
One of the derivative products of the Stocklabs ranking system are a suite of mean reversion algorithms. Each stock is ranked and each industry is ranked and that trickled up to sectors and eventually the entire market. Those composite scores are represented by what’s called the “Overall tech” and “Overall hybrid” scores. The best way to visualize how mean reversion works is to imagine a rubber band being stretched back to its maximum. Eventually it’ll either break and a new level will be found, or in the non violent high probability path, the band will snap back and the scores will head back up.
The algorithms are broken down into different time frames, from 3 months to 30yrs. When viewing the OBOS page you have 3 options.
Backtest: this provides you with choice of how far back you want to go with the mean reversion algos. Do you want to only see recent history, maybe because the market has been unusually volatile, or a much longer period?
Algorithm: You have to choose which algorithm to view, 3mo, 6,12, 2, 5, 10, 20yr and finally historical. To be OS/OB the score must be in the lowest range for that respective time period. The OS, for example, is a moving average of the 3 lowest scores over the respective time period. In other words, say AAPL has been really weak lately and the avg tech score is 1.35 on the 3mo algo. But over a longer period, say the 12mo algo, the avg tech score is 2.5. If today’s score is 1.25 it is OS on the 3mo, but not the 12. Users typically favor the 12mo algo, but it really depends on the type of market you’re in. If markets are crashing in a very unique way, you might want to use short dated algos. If normal, use the longer term algos.
After deemed OS or OB, the system then tracks the stock or industry or sector or the whole market, depending on which algo you're viewing, for a period of 10 trading days, commonly referred to as a "cycle." The data is provided to users what the win rate and average return was over that period. You will see "times up" and "times down" which refers to up or down during a cycle and then the avg return over that time period. This is showing you behavior more than anything else. Certain stocks behave a certain way when pressed to its limits. That behavior is best viewed here, in the OBOS.
You might find some stocks go down right away on a 1-3 day time frame after OS and then rebound sharply from 5-10 days. I have often found the 5 day time period to be most reliable; but it all depends on the data, truly. We are not trying to create a holy grail, only offer you an edge by way of insight into behavior.
OBOS: Choose OS and the data will show you what XYZ did when the stock was stressed to the downside and choose OB for upward momentum. Does XYZ stall after overheating or continue to grind higher? Does XYZ find support after hitting OS? It's all in the data.
Also, just because a stock is deemed OS or OB, or the entire market for that matter, that doesn’t mean the direction of the market or stock is ready to move in the opposite direction. Sometimes the rubber band breaks and new lows or highs are established. During these times, Stocklabs is intuitively learning the new levels and testing them. Other times OB means going higher. As a matter of fact, during bull markets OB means momentum and you will find this condition to be extremely favorable to higher prices. The same goes for OS during bear markets. It’s all data dependent and we’ve found relying on the data instead of labels to be the most optimal way to use the algorithms to gain an edge on markets.
Some rules regarding OBOS:
If flagged OS/OB, only the first signal is counted in our data for a 10 trading day time frame. If OBOS on day 11, it is flagged and then a new 10 day cycle begins. While you might see it marked on the algo page as OSOB, just know for the sake of clean data coverage, only the first signal over a ten day time period is counted. Also, to be considered OBOS, it must close OBOS. Intra day signals do not count in our data.
For the overall system, we favor the 36mo during normal times, 3mo during extreme, and historical algos when all else fails, since it encompasses actual instances thru the 2008 and 2020 market crashes, alongside many other market squalls along the way.
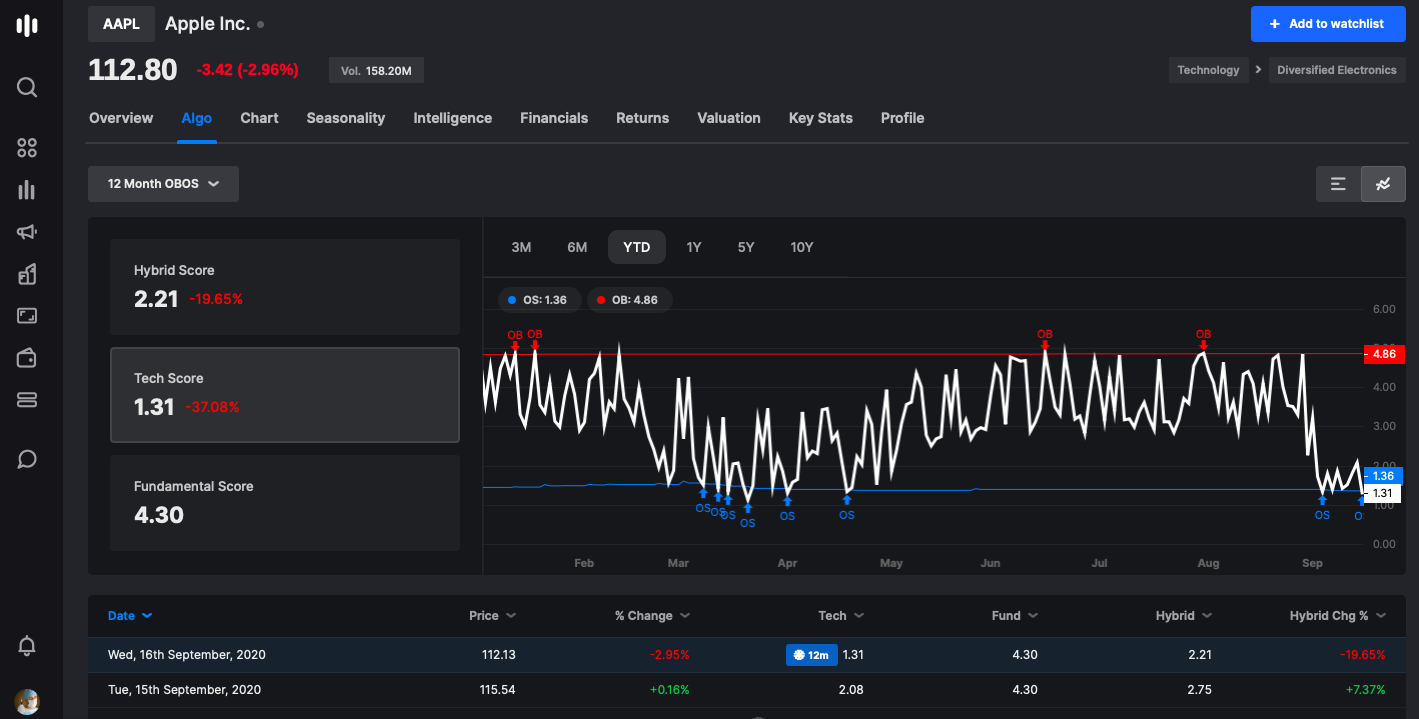
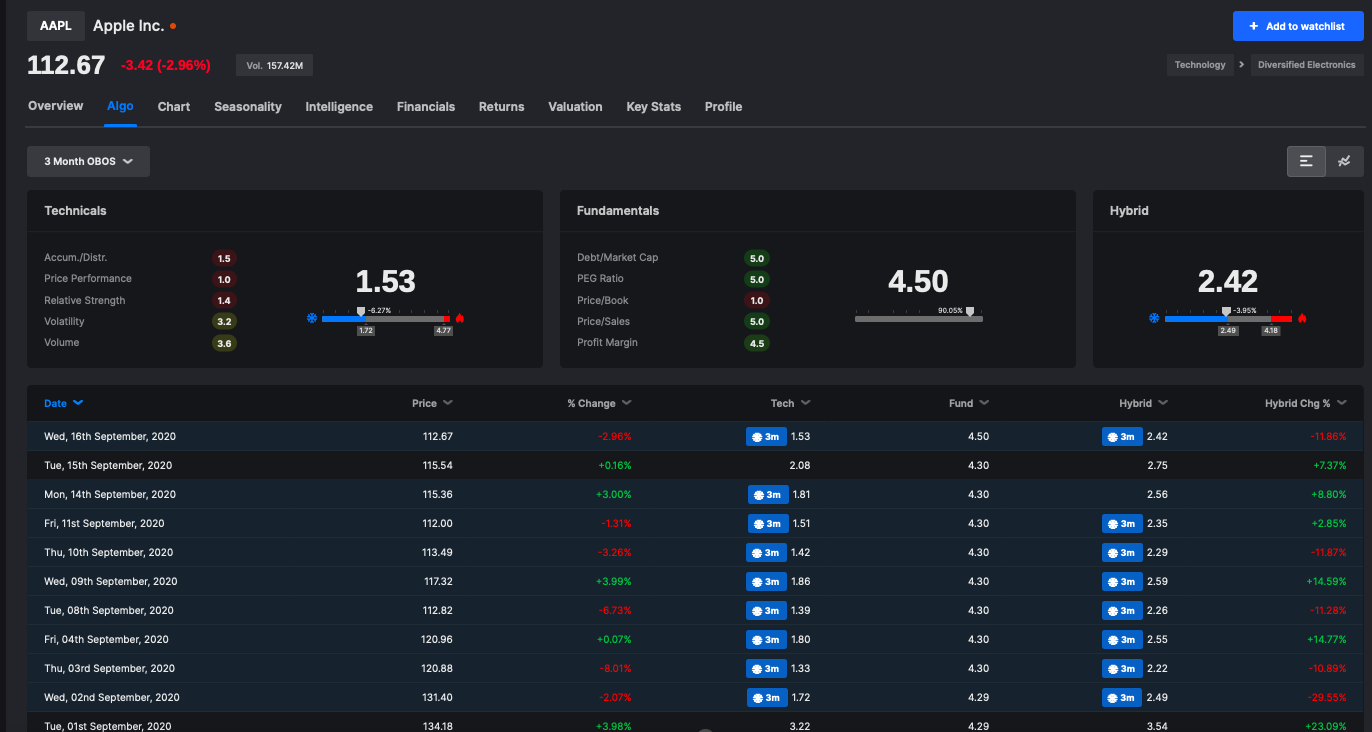
The ranking of all stocks streams and changes non-stop. You can view these scores on the algo page and the levels are scaled on a 0-100% scale. Anything 0% or below is OS, and vice versa. To see the history of these scores, simply click on the chart icon on the algo page and voila -- all instances are annotated on chart displaying history of respective algorithms.
Comments
0 comments
Please sign in to leave a comment.