
Livefloor
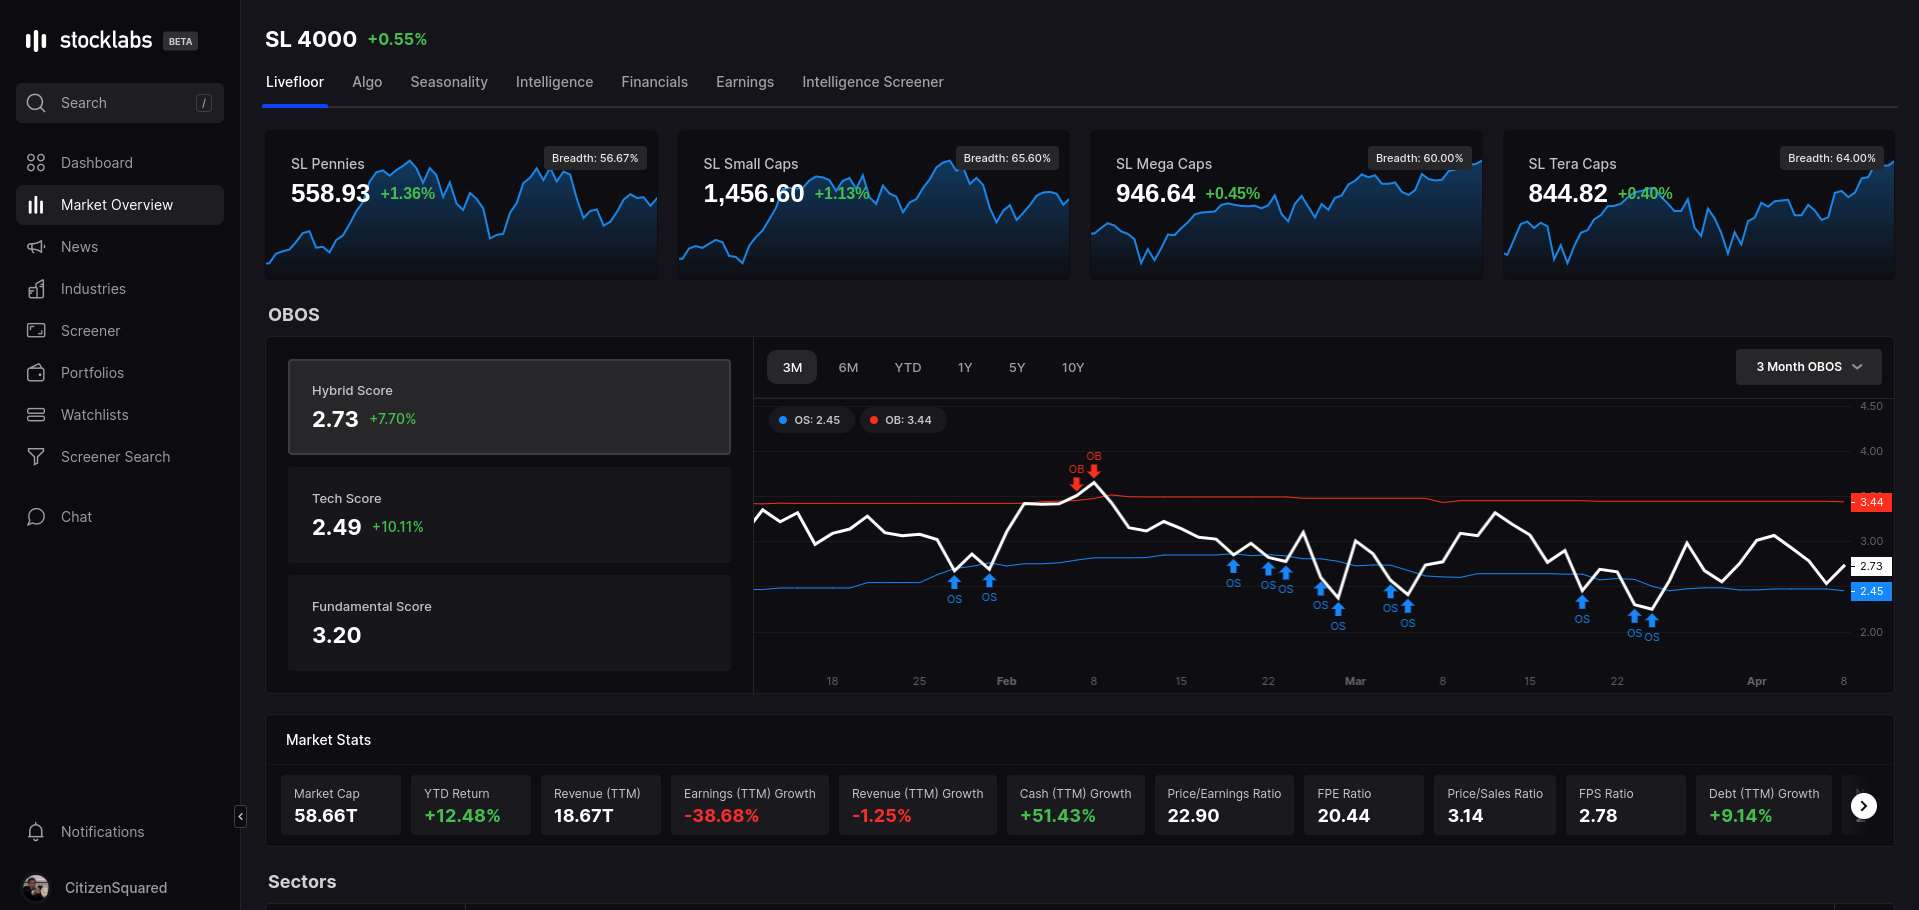
The LiveFloor is the first place to look to get apprised on market conditions for the day. Across the top are Stocklabs market cap indices: SL Pennies (150 tickers <$250M cap), SL Small Caps (250 tickers <$1B), SL Mega Caps (50 tickers <$100B), SL Tera Caps (50 tickers >$150B). These indices are built by SL & update dynamically depending on stocks continuing to meet the requirements to be in the index. A glance at these indices tells the tone of the current tape.
Below the indices are the current marketwide OBOS statistics in numeric form on the left & time series chart form to the right. Clicking the OBOS criterion displays that statistic in the chart pane, which can then be toggled across different timeframes ranging from 3 month to 10Y. Superimposed on the chart are are the corresponding Overbought (OB) or Oversold (OS) signals depending on the timeframe chosen in the top right.
Across the middle of the page are fundamental & technical statistics for the market based on current prices including Total Market Cap, YTD Return, TTM Earnings & Revenue, Current & Forward P/E & P/S, and more.
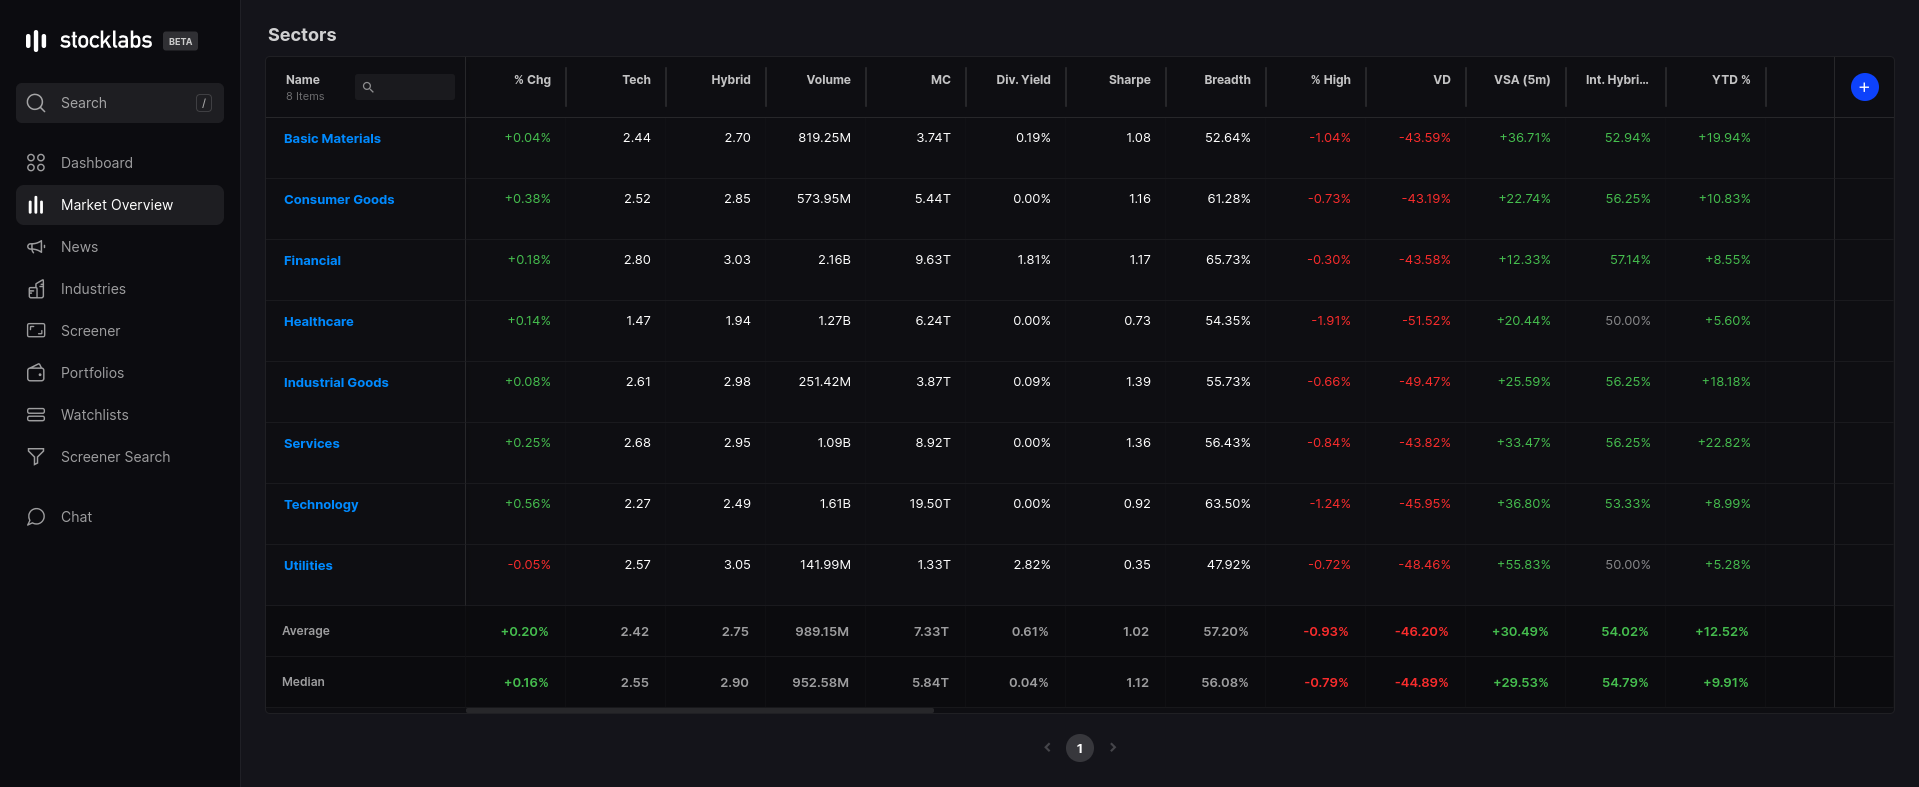
The table below the global statistics breaks the market into primary sectors & displays Stocklabs scores & market data for that sector. Clicking any one of them opens up the group to show the same statistics for each subsector comprising the group. The bottom panel on the Livefloor page shows custom indices built around particular themes that at one time or another feature prominently depending on the conditions of the market, along with their Stocklabs ratings & key stats.
Algo & Seasonality
To the right of the Livefloor tab are the Algo page & Seasonality. Navigating to the Algo tab will show the same Stocklabs scores & OBOS from the Livefloor page except in table form.

On the Seasonality page can be found S&P returns broken down by monthly returns in both chart & table form. Hovering over a particular month displays the average return for that month on the chart.

Intelligence
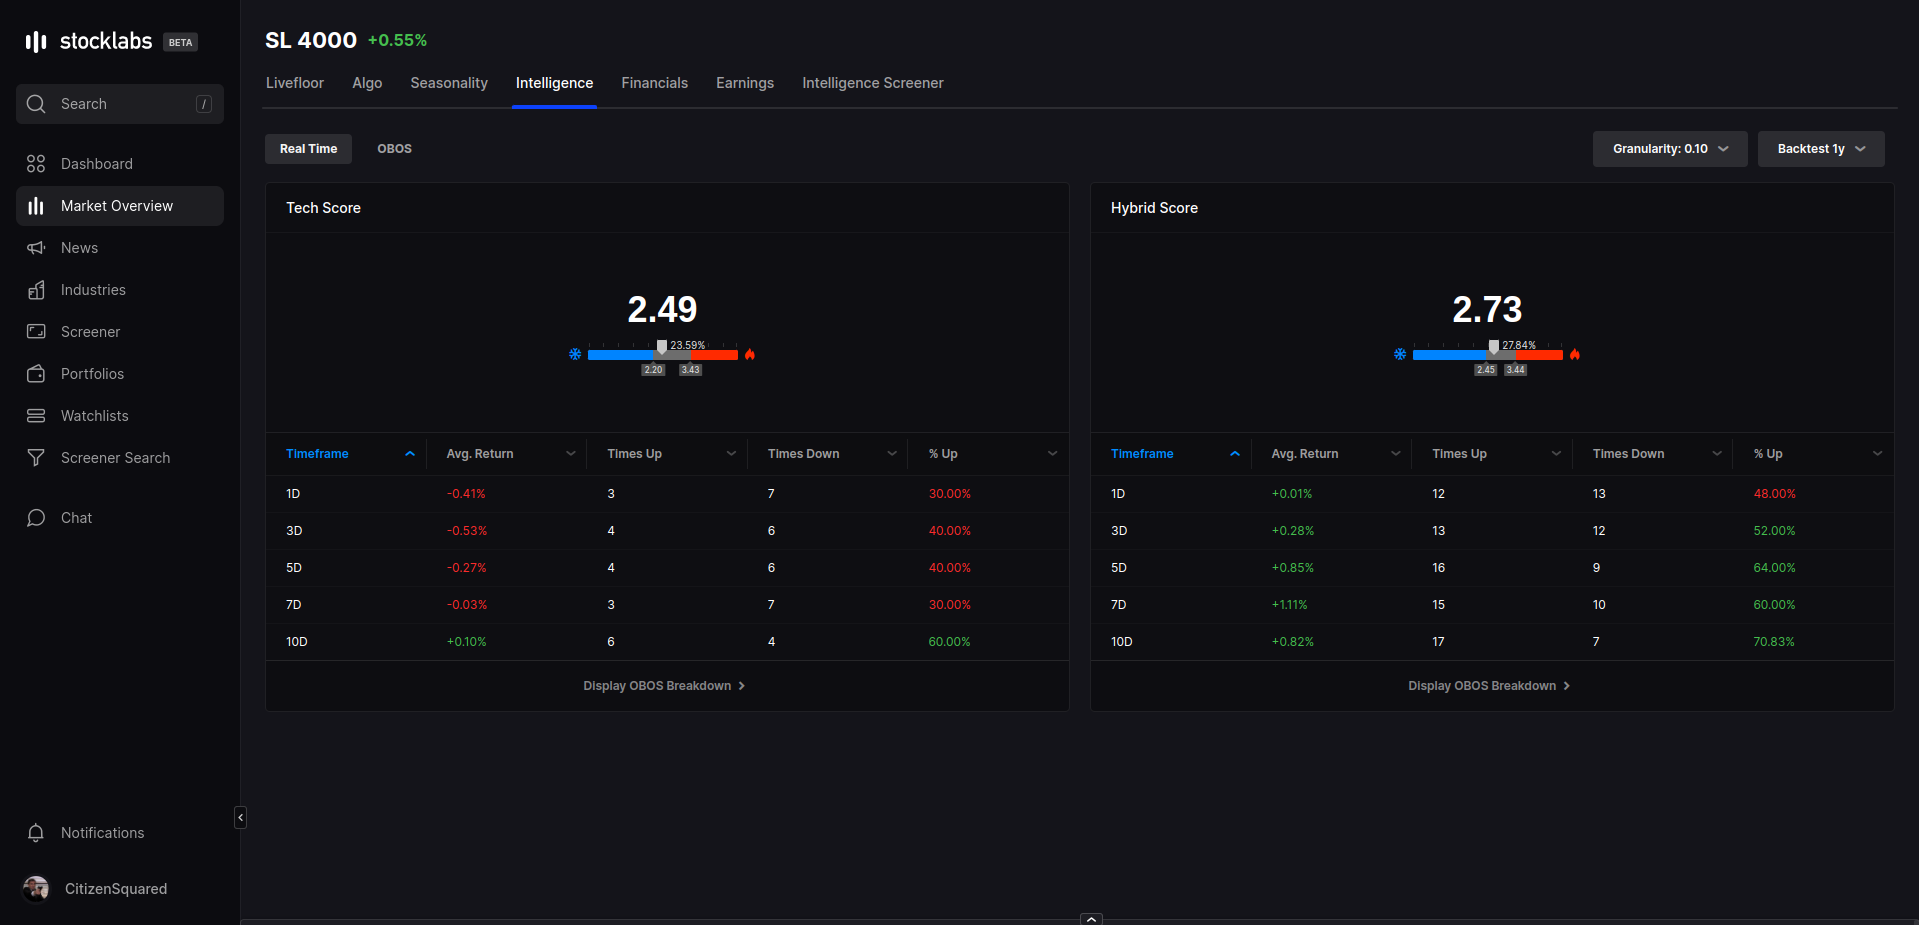
Further to the right is the Intelligence tab, new to Stocklabs, which gives SL's real time assessment of how the market has behaved in similar circumstances. The current Tech & Hybrid scores are shown & tabulated below are forward returns ranging from 1 to 10 days in other. Granularity on the right determines the level of exactness SL will look at while the Backtest menu selects the period it will use when matching the Tech or Hybrid scores to forward returns. In the example below, Granularity is set to 0.10 & Backtest at 1 year, so taking the current Tech Score of 2.49, Stocklabs is looking at all the times in the past 1 year the market had Tech Scores of 2.39-2.59 (0.10 on both sides of 2.49) & giving the number of instances as well as the average returns associated with that score. The same can be said for Hybrid Score except the range it is looking at is 2.63 to 2.83 (0.10 either side of 2.73).
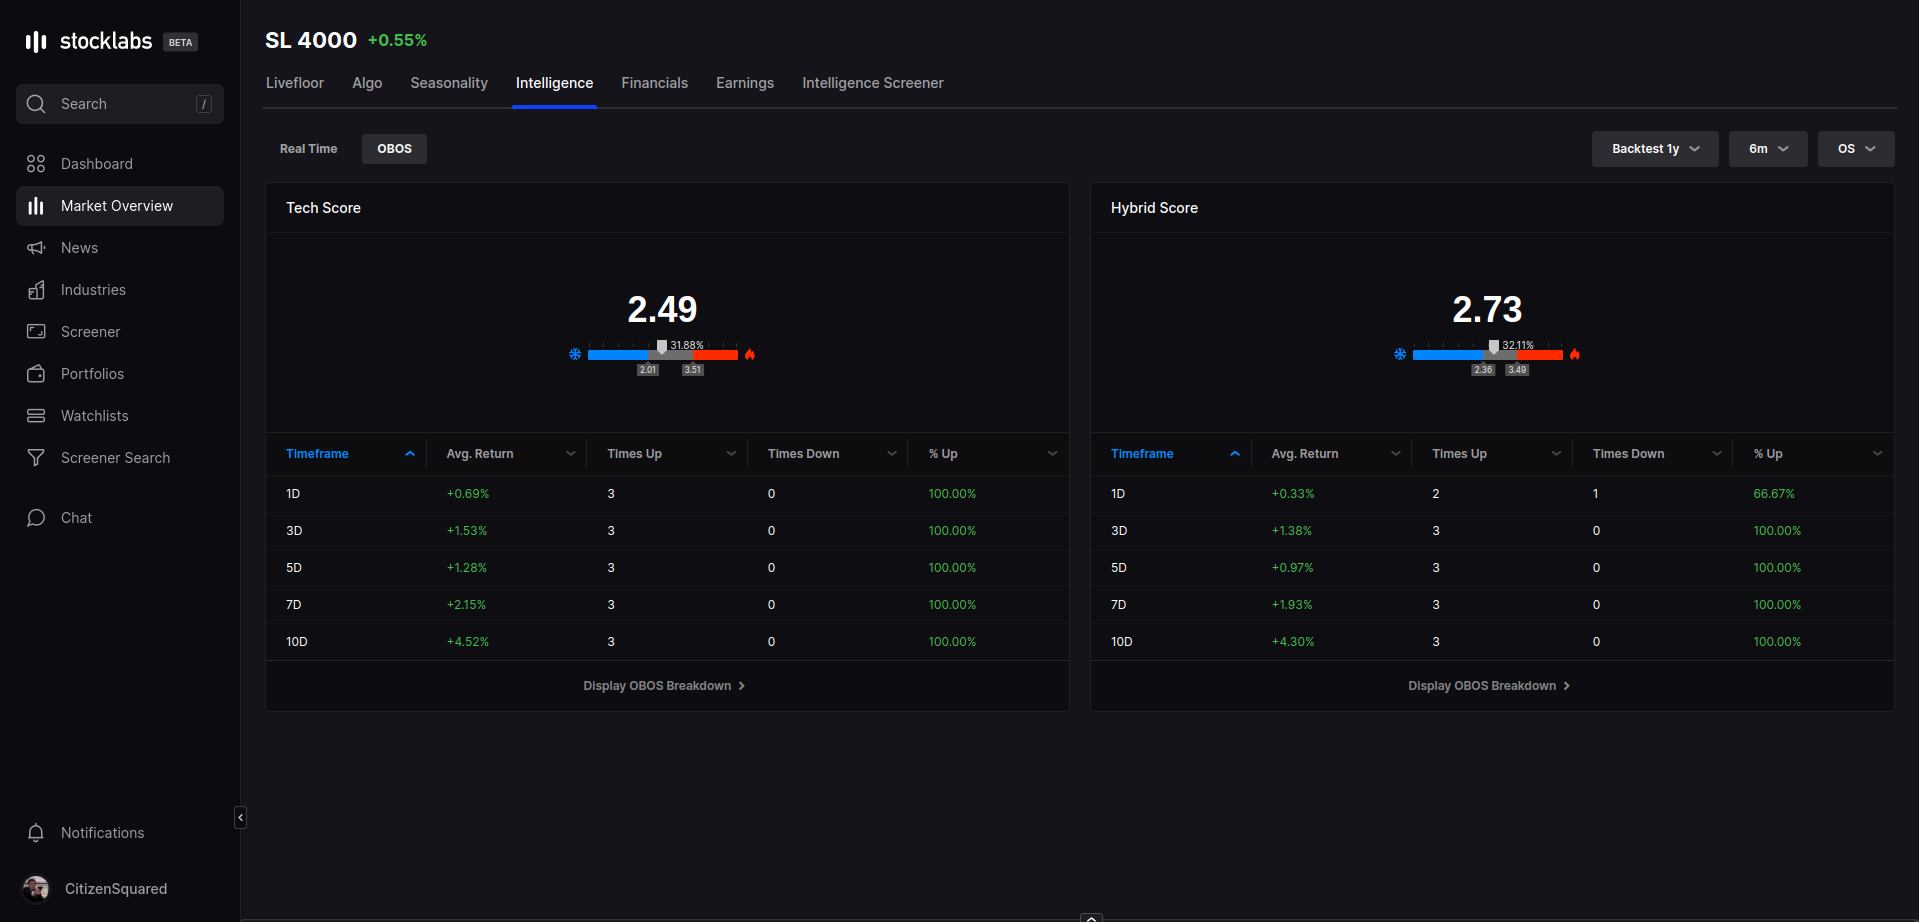
Toggling from Real Time to OBOS shifts from Intelligence to the legacy market Overbought-Oversold (OBOS) data & can be viewed across different time frames & backtest periods. The time frame toggle adjusts the range of the OBOS thresholds accounting for varying periods of market stress while the backtest selection determines the look back period SL will count the number of instances. In the example below, a 6 Month OS signal is used with a 1 year backtest, which produced 3 signals, all of which saw the market finish higher on average across all the relevant time frames if taking the readings on the Tech Score side.
Financials & Earnings
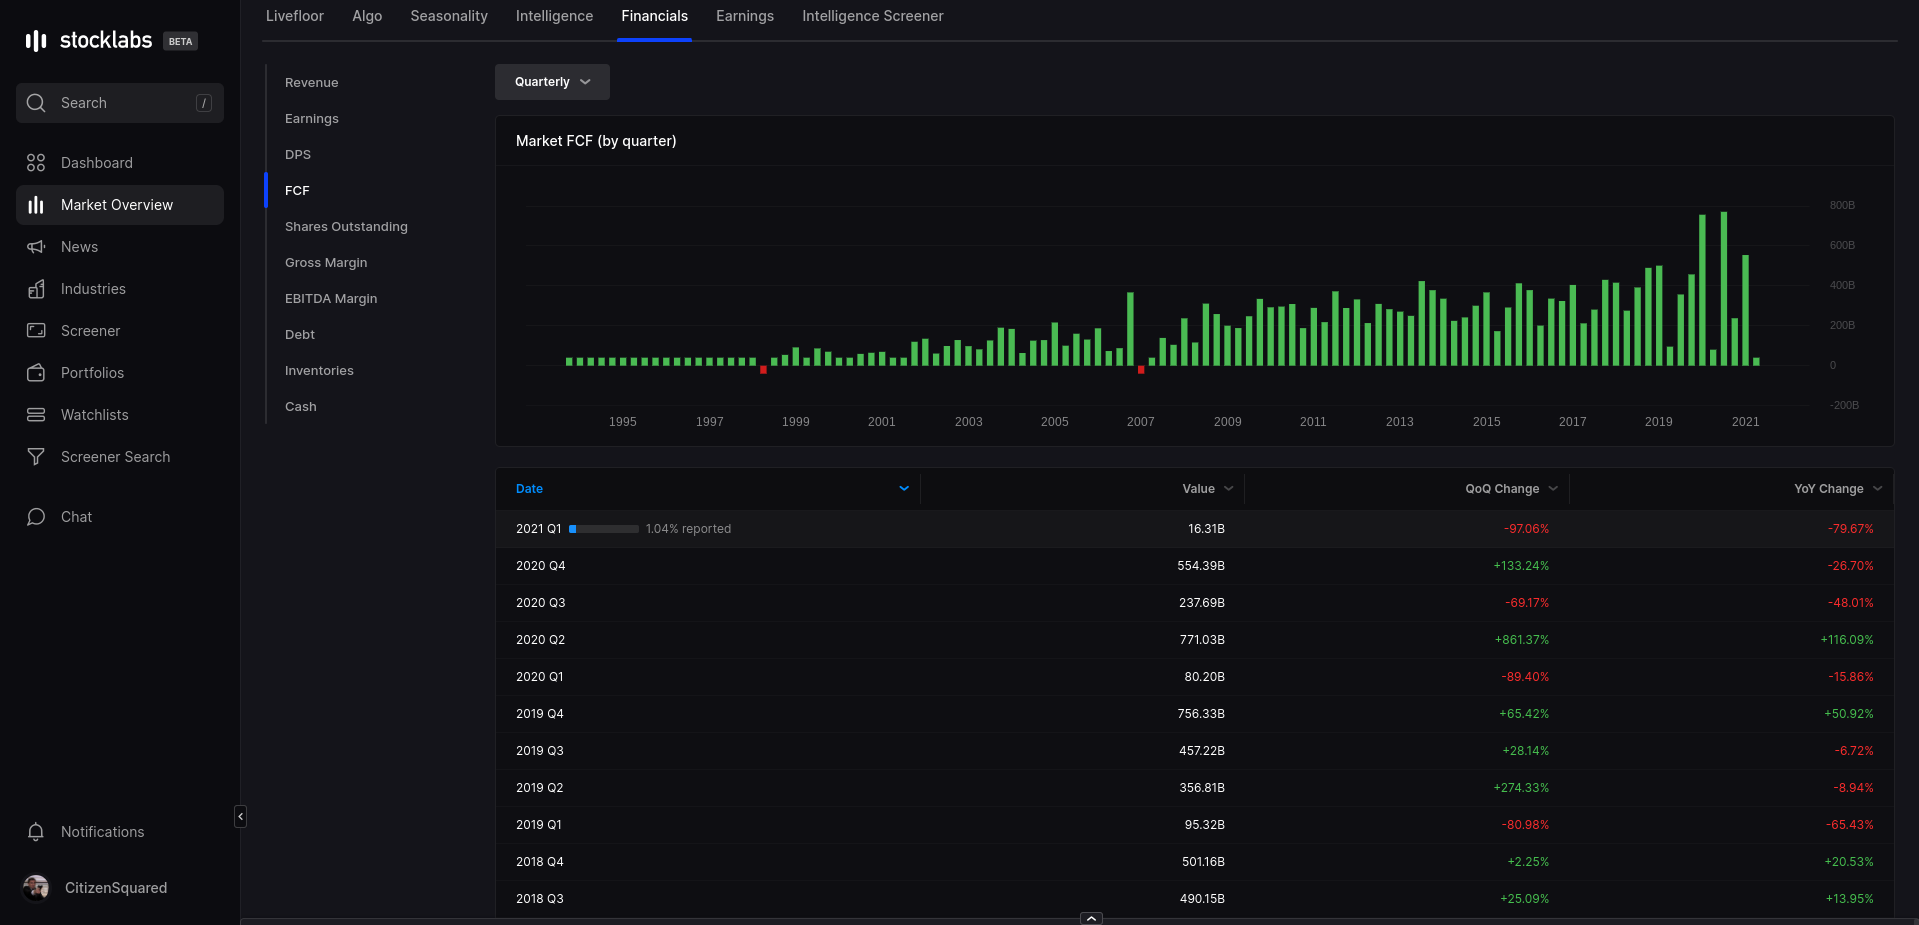
Stocklabs also provides real time data for the fundamentals across the market. The Financials tab gives aggregated market data going back to 1993 to show trends for metrics such as Revenue, Earnings, Free Cash Flow (FCF), Gross & EBITDA Margins, & others. Choosing a metric on the left populates the graph at the top with Quarterly data by default & can be toggled to Annual, with the same data tabulated below. The current quarter updates as earnings are released & shows how many reports have been filed thus far.
Staying up to date on these upcoming reports can be done on the Earnings tab. Each day across the top shows the number of reports expected that day & clicking a particular date populates the table below with the those companies expected to report.

Intelligence Screener
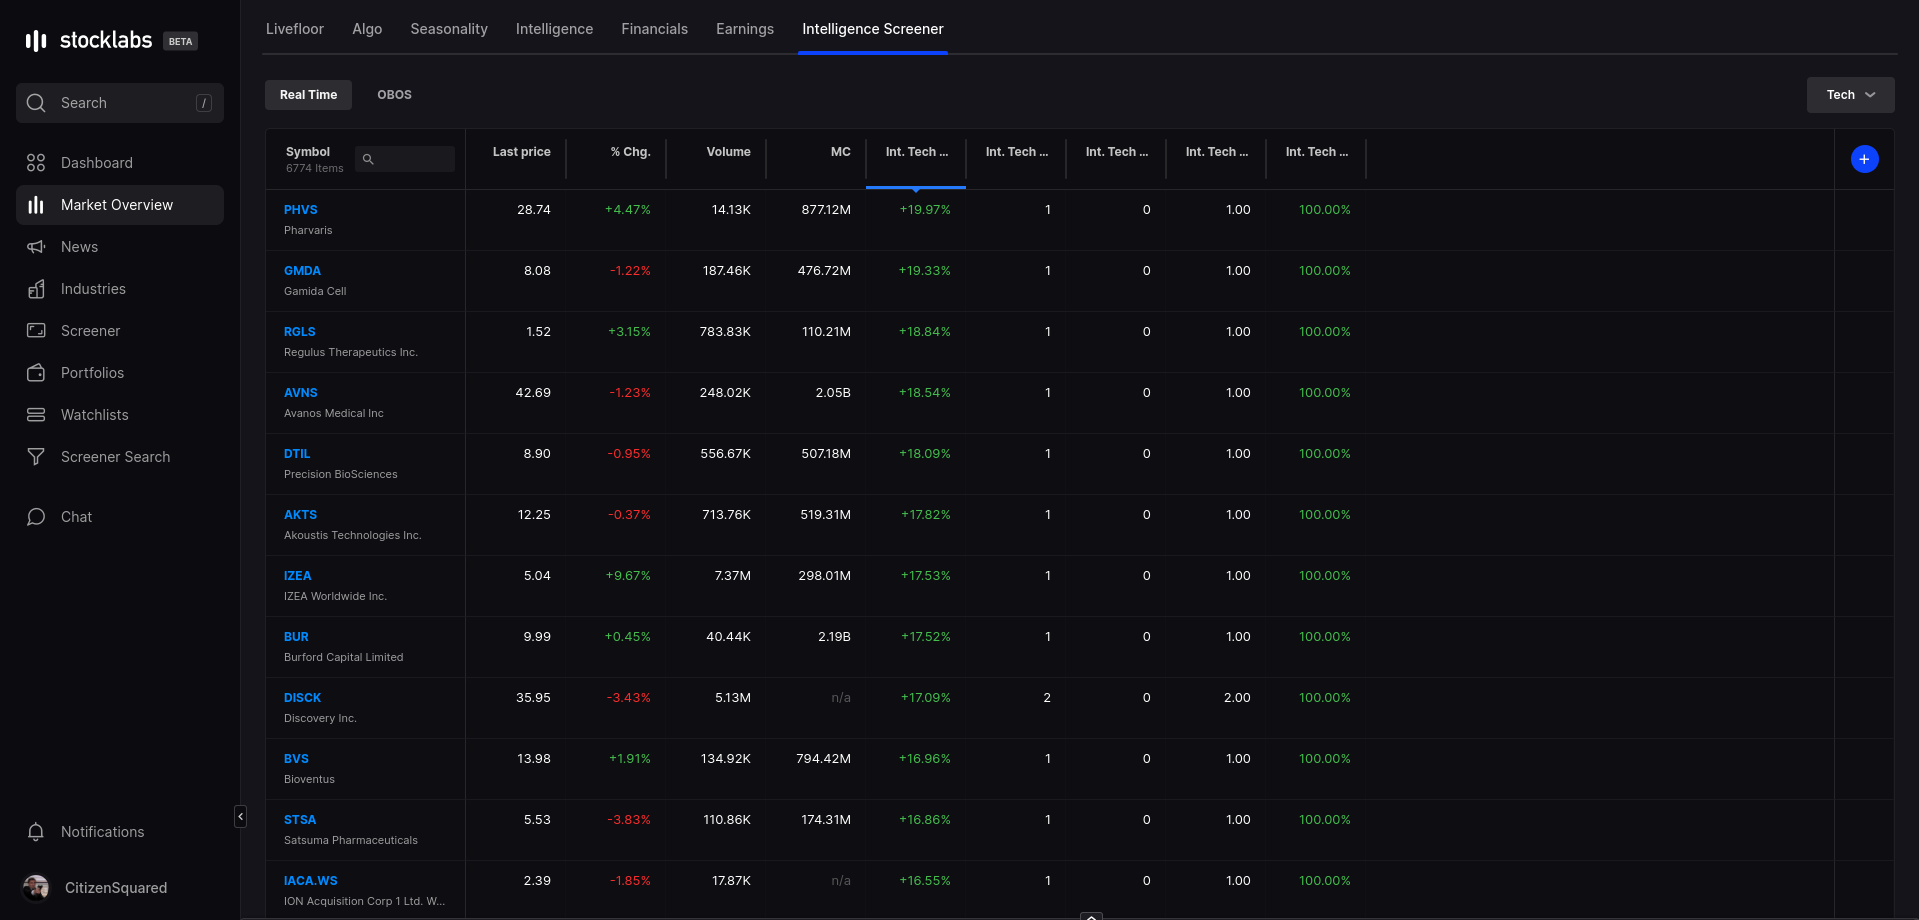
The final tab inside Market Overview is the Intelligence Screener. In here the Intelligence method described above from the market wide Tech & Hybrid Scores is applied to individual stocks, with the results tabulated. The table by default is sorted by Intelligence 5 day forward returns, but it has full Screener functionality which can be used to further narrow down the results depending on additionally chosen criteria using the "+" sign in the top right & clicking column labels to change parameters. You can find a more in depth review of general Screener use in the rest of the FAQ.
Alternatively, switching from Real Time to OBOS again moves from Intelligence to traditional Overbought-Oversold, displaying stocks that have hit their critical threshold (OB or OS) & sorted by Returns. The menus on top right allow for changing the screen parameters in the same way discussed for the general market OBOS above.
And?
Cycling through these main pages of Stocklabs will show you almost everything you need to get started assessing the current market & formulating a plan for the day, week, month, or longer. The real time & trend data compiled brings you up to speed with how everything is moving & helps filter out a lot of the noise associated with figuring out the right course of action.
More to come. See you inside Stocklabs.
Comments
0 comments
Please sign in to leave a comment.