
The Stocklabs valuation tools offer a fantastic insight into the fundamentals of each stock, industry, sector and the market as a whole. We base our valuation tools around price-to-book, price-to-sales and price-to-earnings ratios.
Traditionally, one would lean on the price-to-book ratio for financials, price-to-sales for growth and price-to-earnings for bigger companies with predictable earnings trends.
Below is an example of price-to-sales valuations for the Application Software industry. Our data goes back decades and it offers a wonderful way of assessing how the market is valuing an industry. We offer comparisons to its own 3yr avg and median, as well as comparisons to the respective industry, sector and overall market.
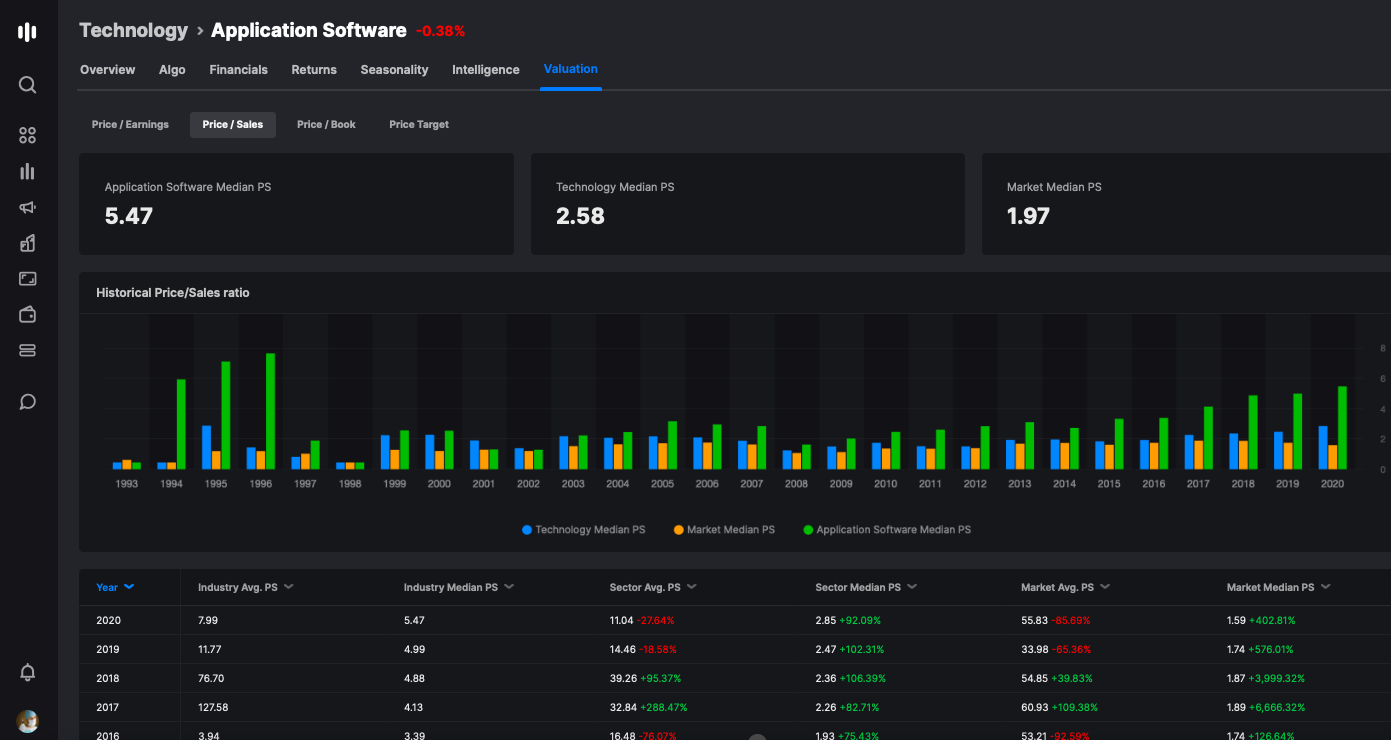
Why do valuations inflate? Several reasons. The most obvious is innovation and growth. A high growth stock will be richly valued based off future expectations. Another reason is Federal Reserve policy. Lower rates cause whole industries to undergo 'valuation expansion' as the attractiveness of equities increases and the debt burden lessens via carrying costs. Other times valuations blow out due to a speculative bubble. Eventually, in those instances, we could expect valuations to eventually revert back to the mean (average). If you're wondering what the mean is -- Stocklabs displays it at all times.
Another way to use our valuation tools is via the screener by selecting % FPS target and % FPE target. Stocks have a tendency of gravitating close to their historical price-to-sales and price-to-earnings ratios. We offer insight into potential upside and downside for stocks by applying its median price-to-earnings and price-to-sales multiples to earnings and sales estimates for the forward year.
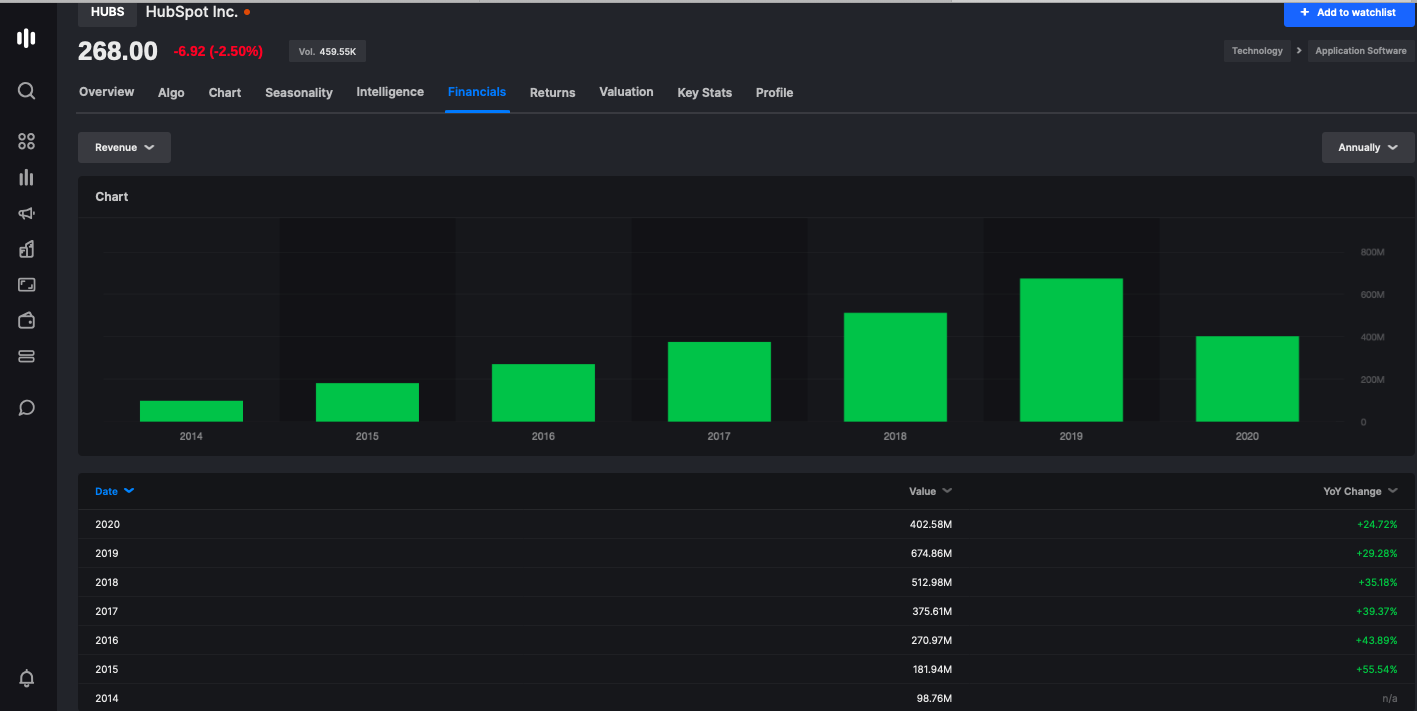
For example, here is something I worked out on a spreadsheet, before Stocklabs, back in 2017ish -- regarding HUBS.
Price: $122
Price-to-sales ratio: 9.7x
Shares outstanding: $39m
Market capitalization rate: $4.7b
Forward price-to-sales ratio based off sales estimates: 7.5x
Historical price-to-sales ratio: 11x
Price target: $180
Premium: +47%
Fast forward three years and HUBS has a market cap of $12.2b and is trading 16x sales. Since 2017, the company's growth has been in excess of 30%. In order to extrapolate a price target, you'd need to asses their sales over the next three years and apply a price-to-sales ratio to it. Clearly, the 16x price-to-sales ratio is a blow out, due to the current fever in SAAS stocks -- sending the stock +270% since 2017. However, even at the original 11x sales estimate from above, based on current sales the stock would be +60% over the past 3 years -- nearly double the SPY over the same time period.
Comments
0 comments
Please sign in to leave a comment.