
Introduction to Portfolios
New to Stocklabs is the ability to input your portfolios for tracking & evaluation purposes. This feature can be found on the left under Portfolios. In here are tabs for My Portfolio, Following, & Community portfolios. Any portfolio you create will appear in the My Portfolios tab; Following displays a list of other users' portfolios you have chosen to track, while Community displays all the public portfolios created in Stocklabs which you then have the option to add to your Following list should you choose. The Daily (% Chg), Week to Date (WTD %), Month to Date (MTD %), Year to Date (YTD%) returns, & Value of Open positions (Pos. Value) which is the portfolio value less the cash balance, are listed for each portfolio. 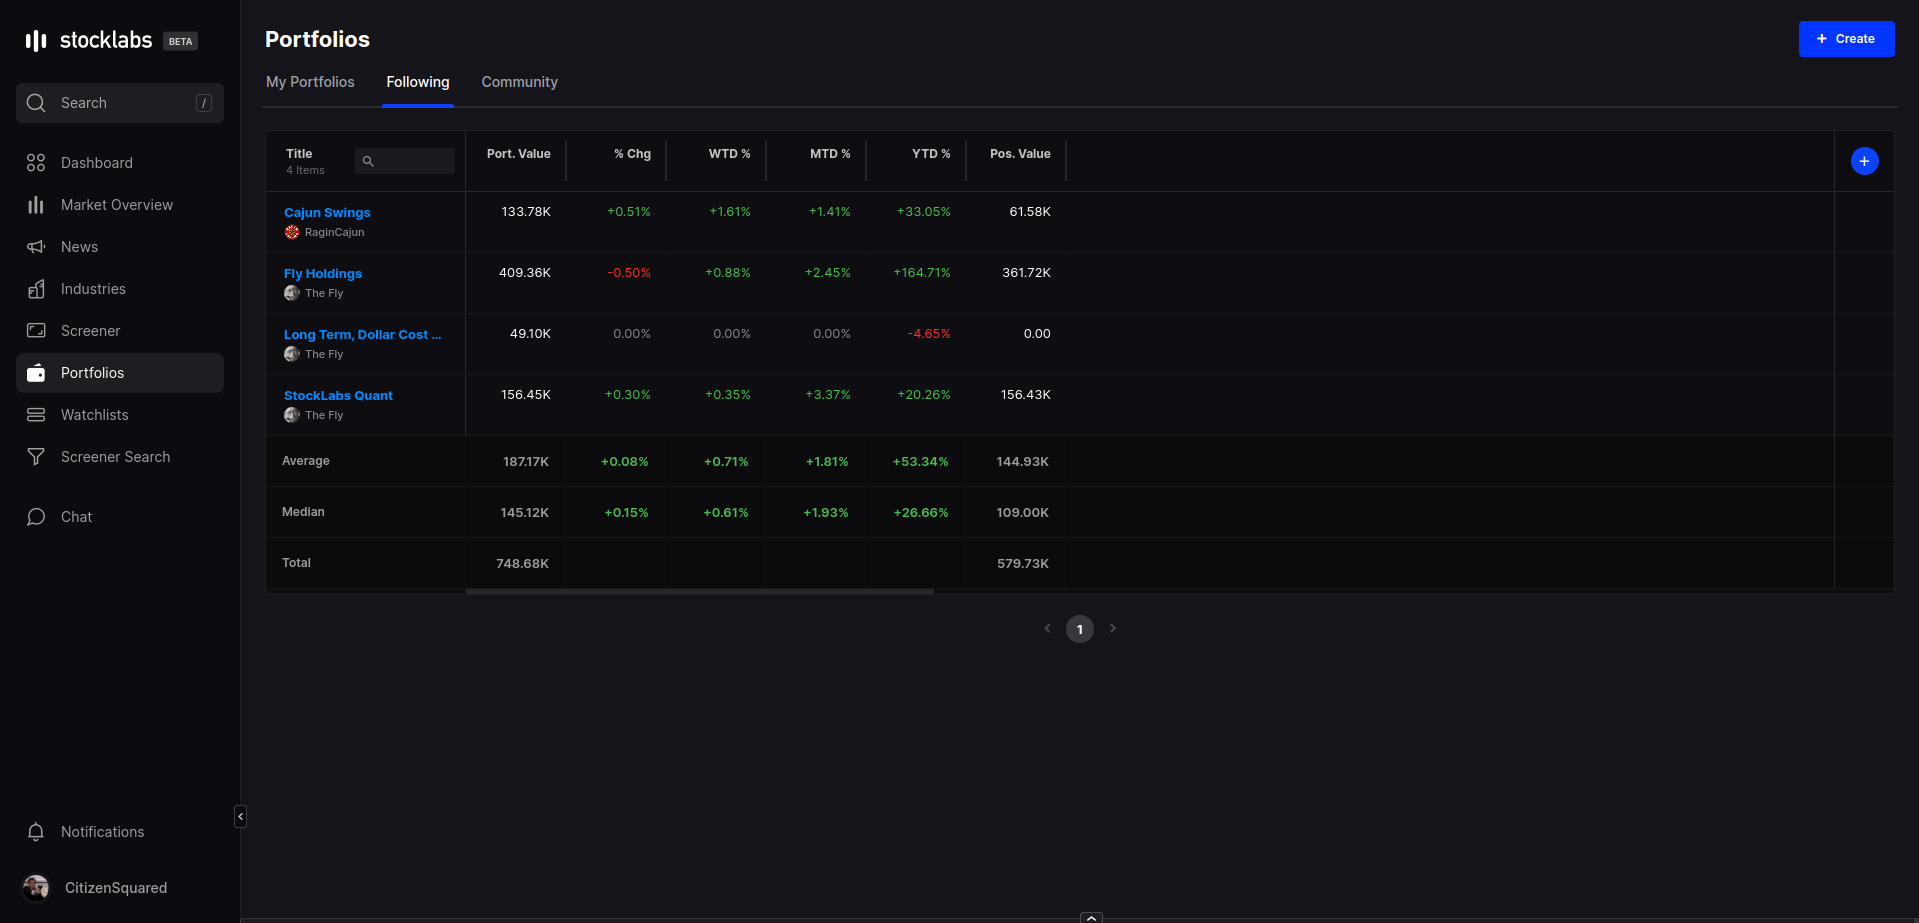
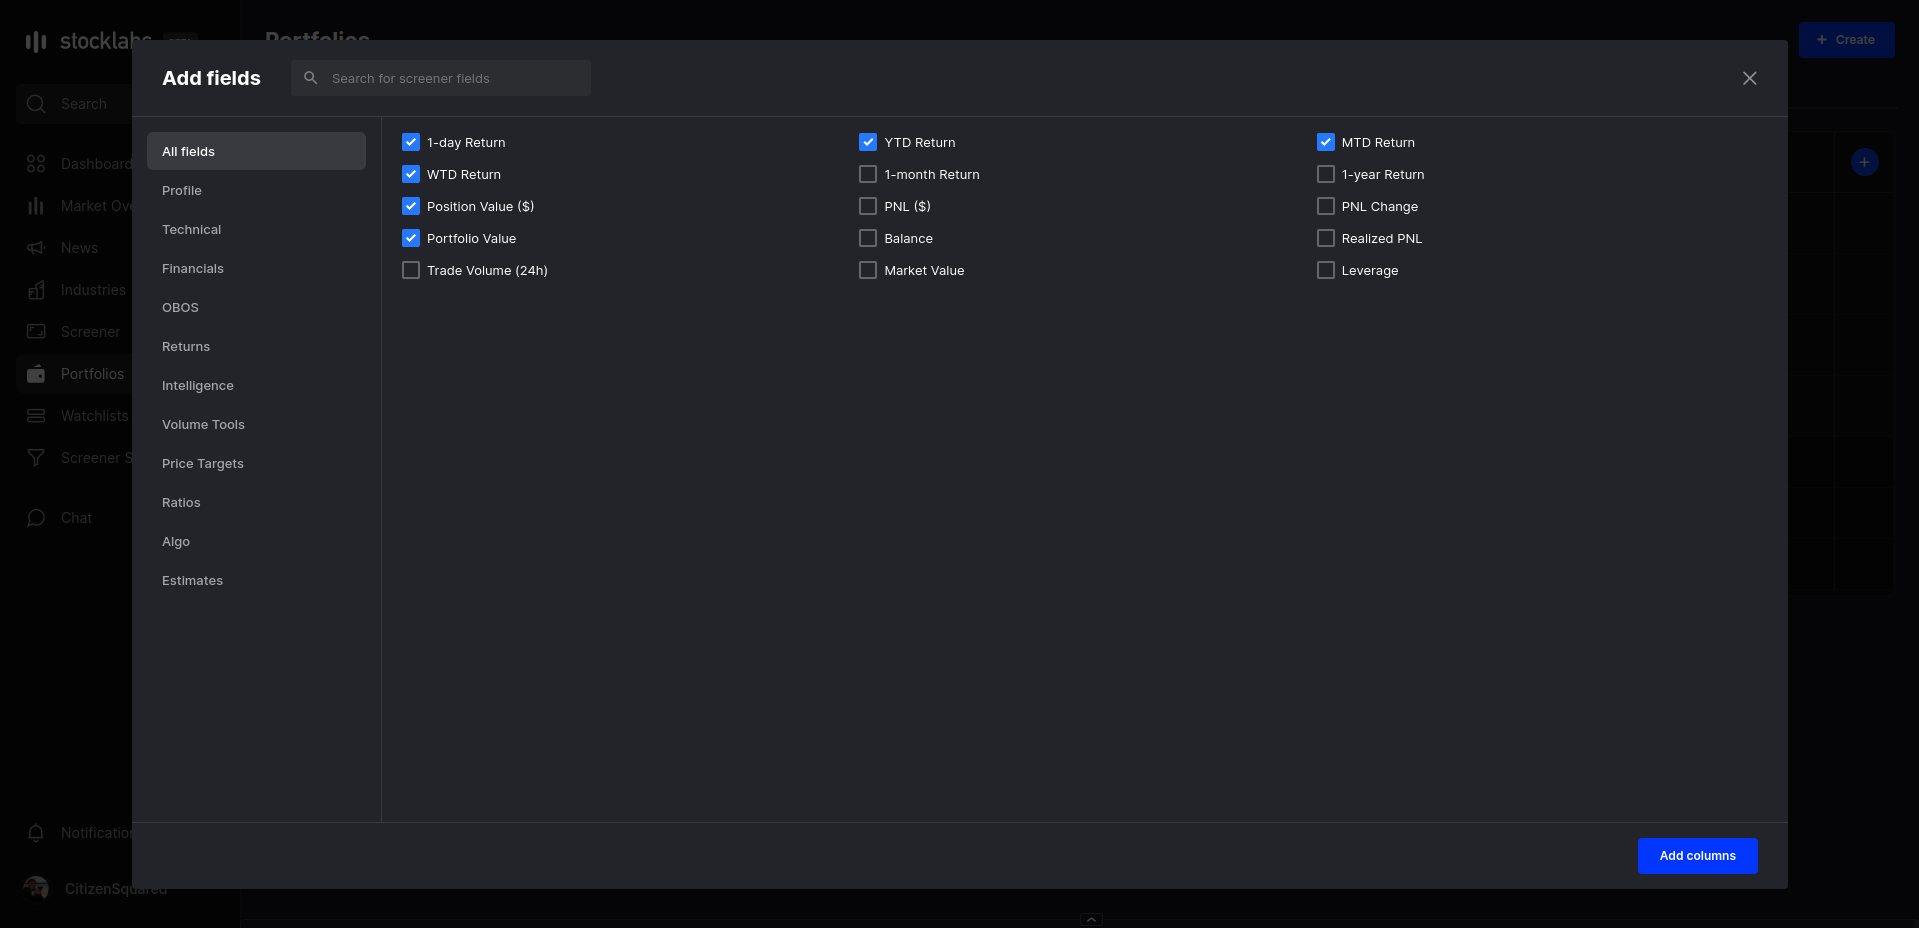
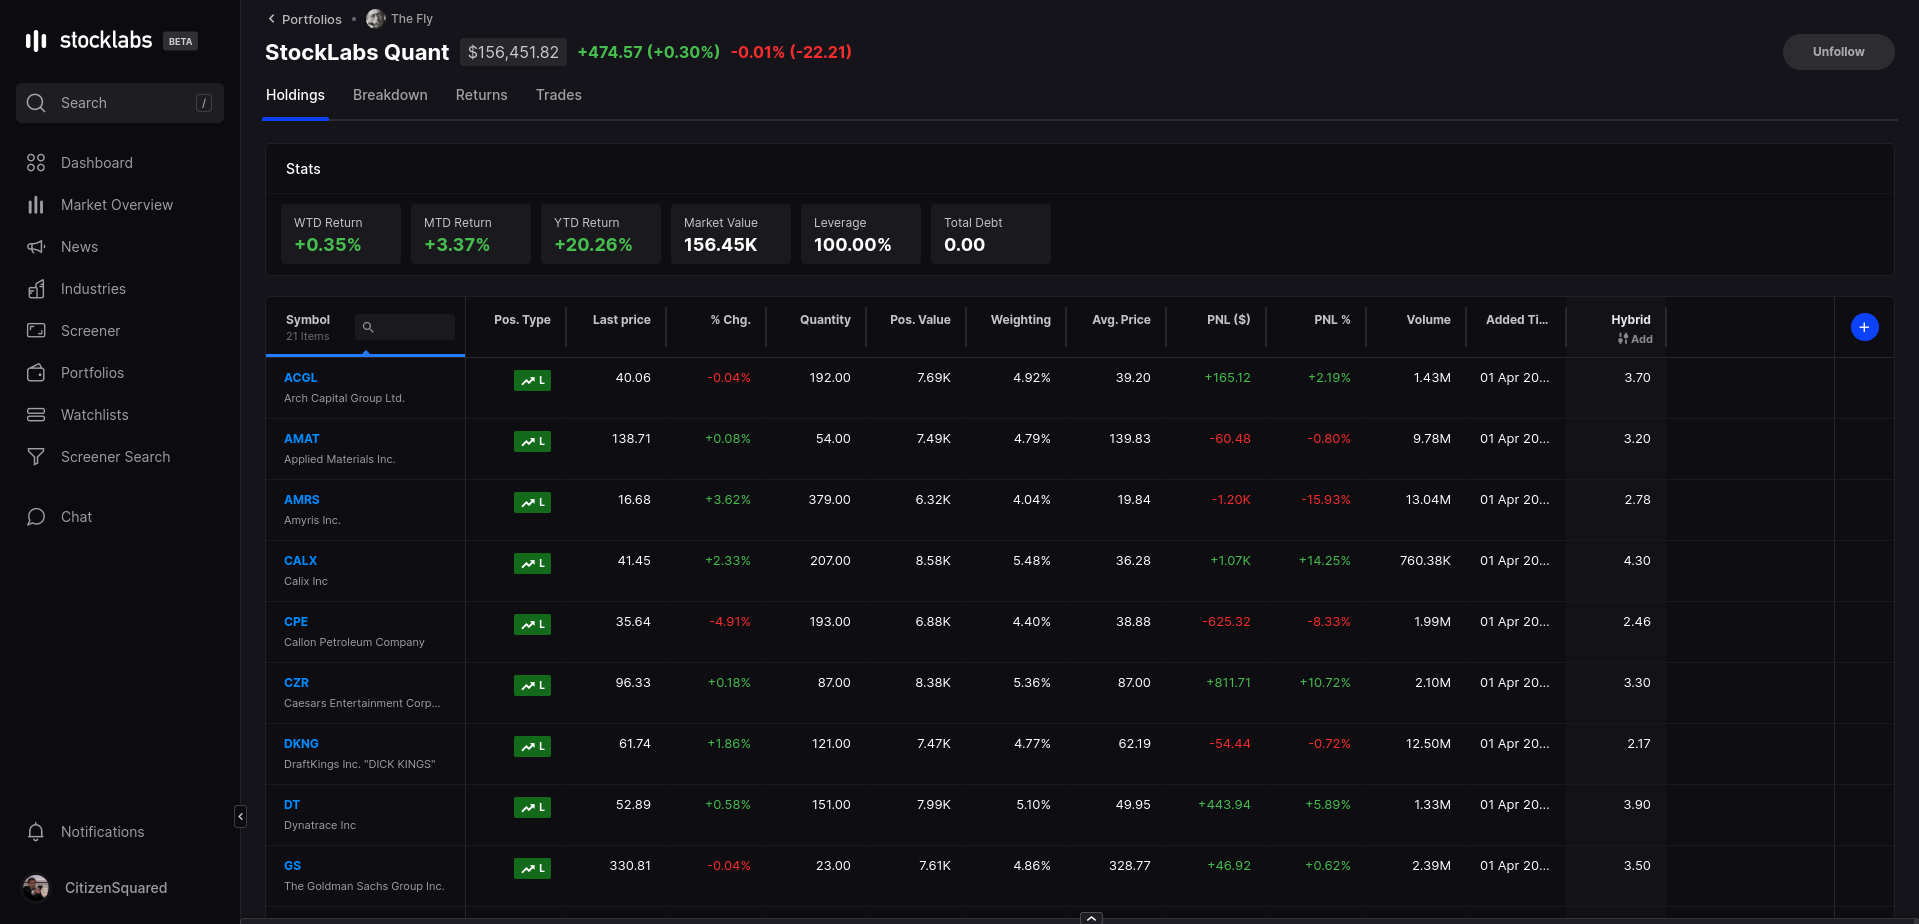
The "+" sign in to the left allows for adding additional columns of portfolio statistics or balances if desired.
Creating a Portfolio
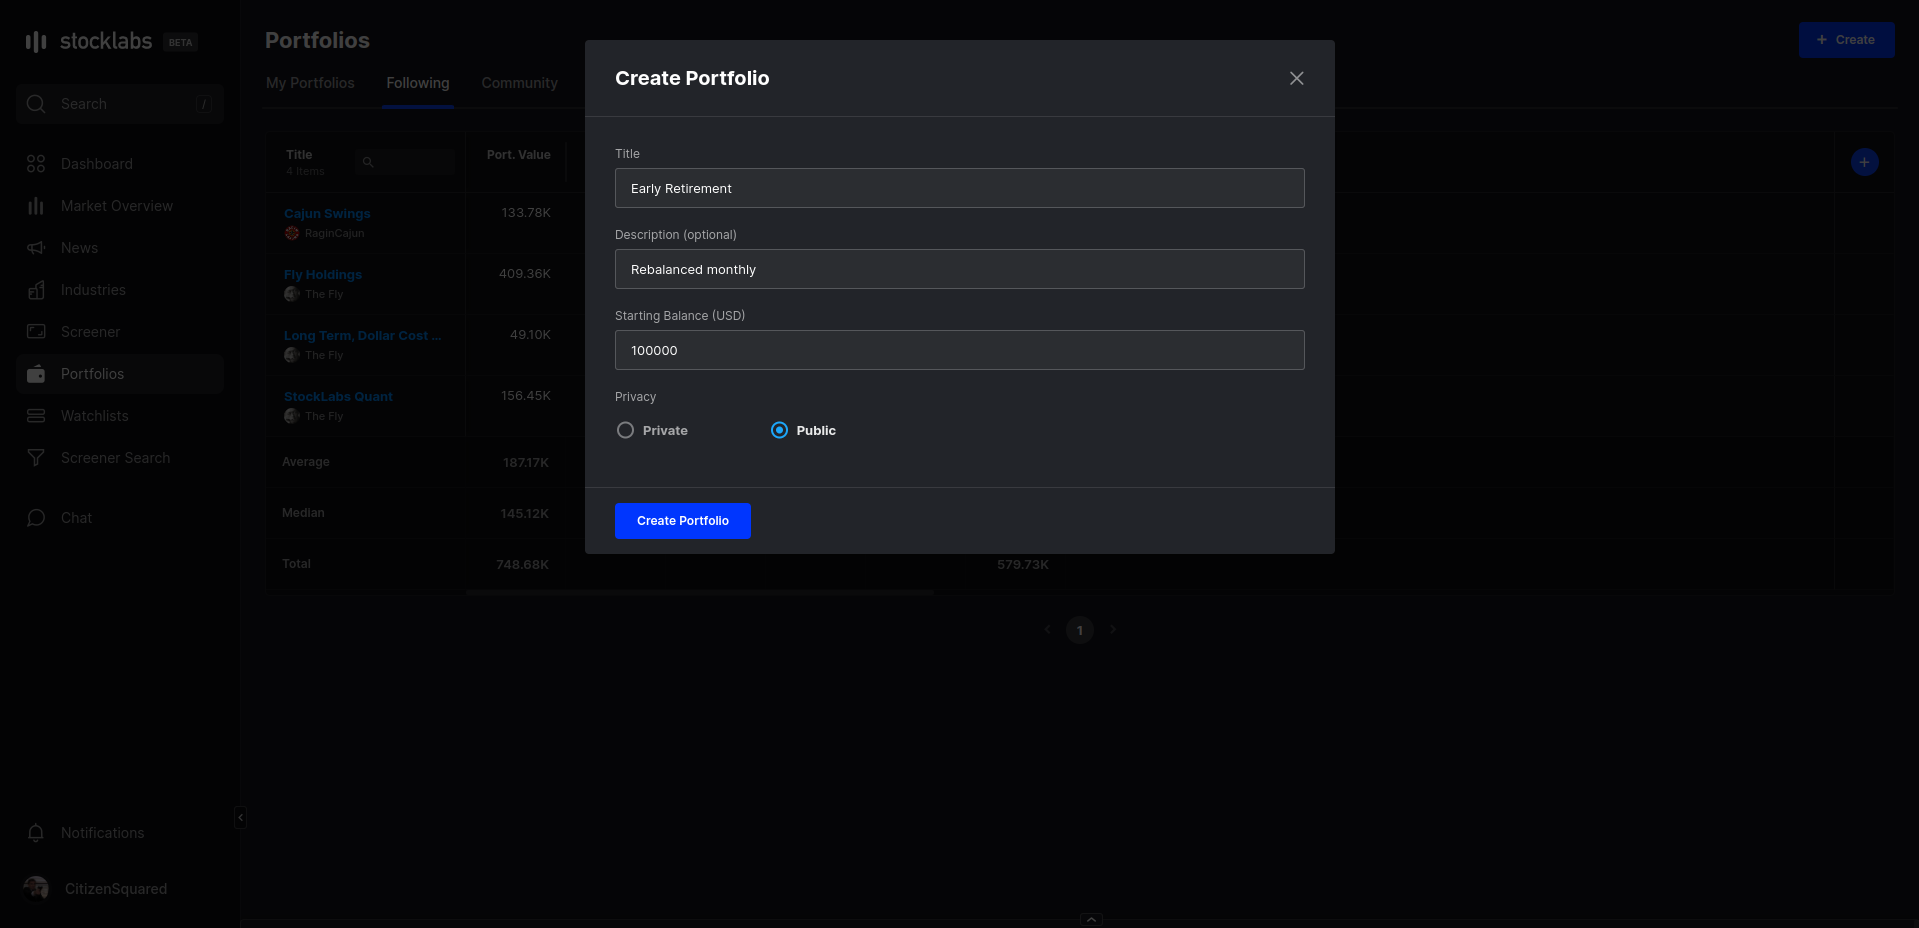
Getting started inputting a portfolio is done using the Create button in the top right of the window. A dialogue box will open asking to name the portfolio, along with the option to add a supplemental description. Starting Balance defaults to $100,000 & can be changed to whatever $ amount is being tracked, along with the option to mark the portfolio as Public from the default Private. Choosing Public will allow the portfolio to be found in the Community tab from above, while Private will keep it for only your viewing under My Portfolios.
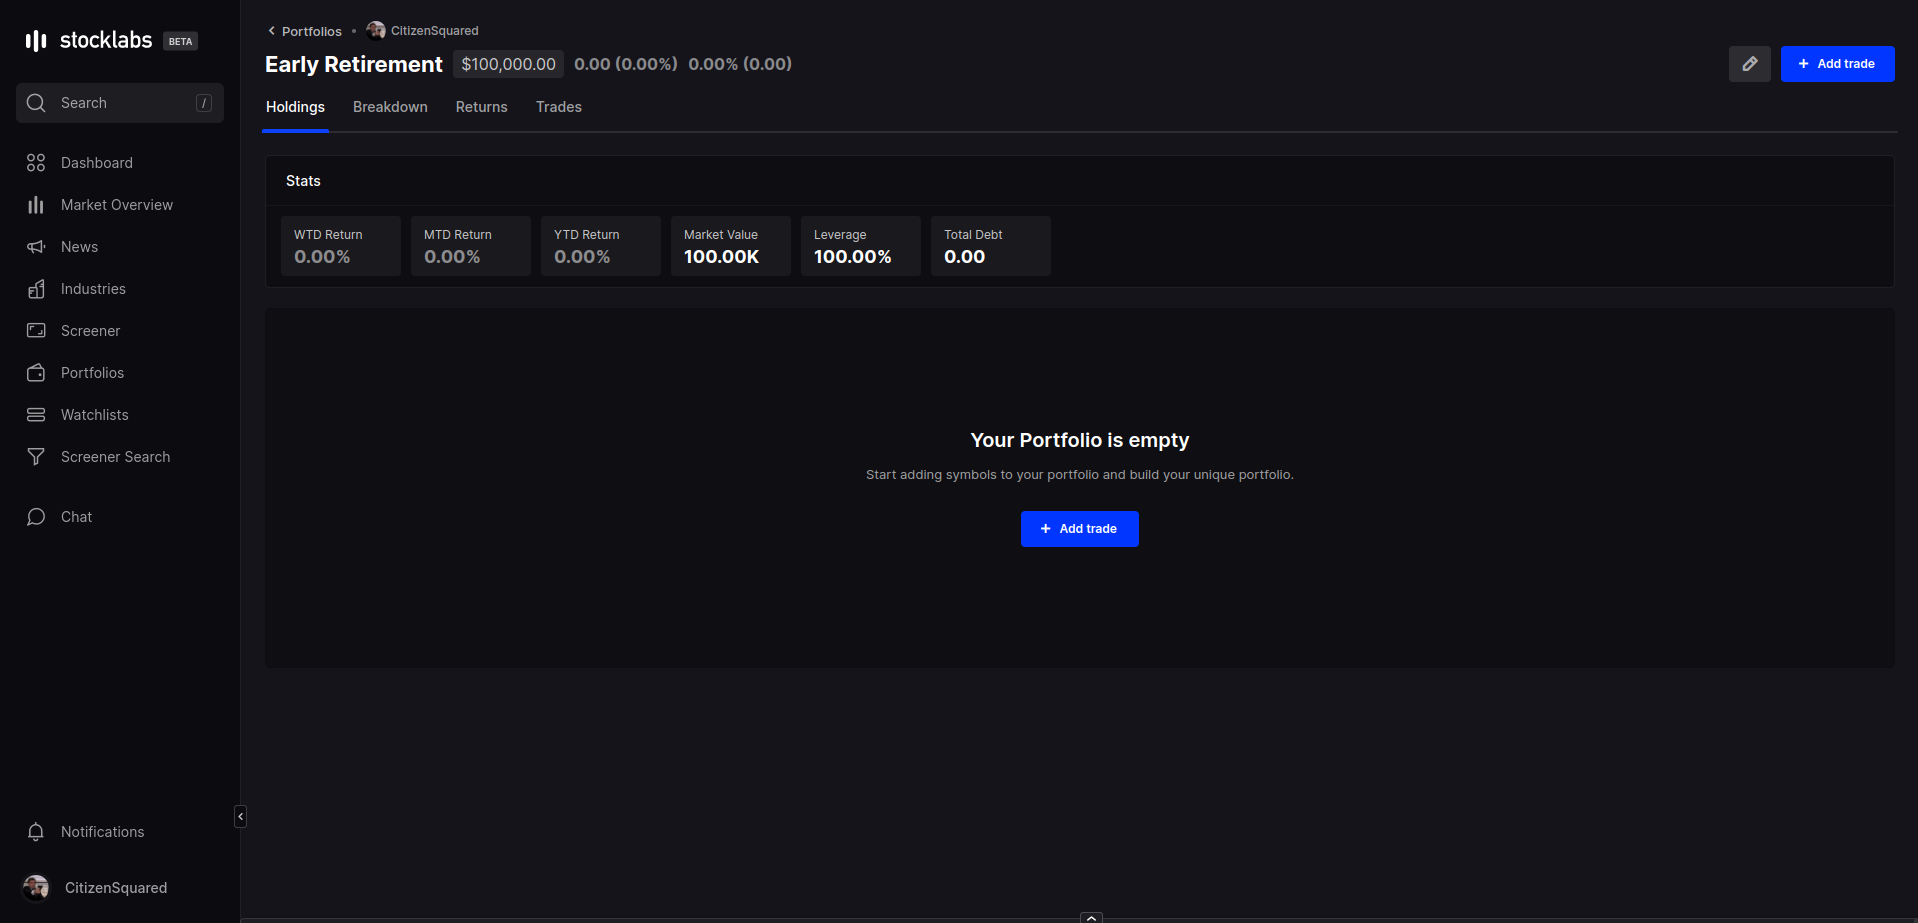
Once the portfolio is created, it's time to add your positions. This is done via the Add Trade button in the top right.
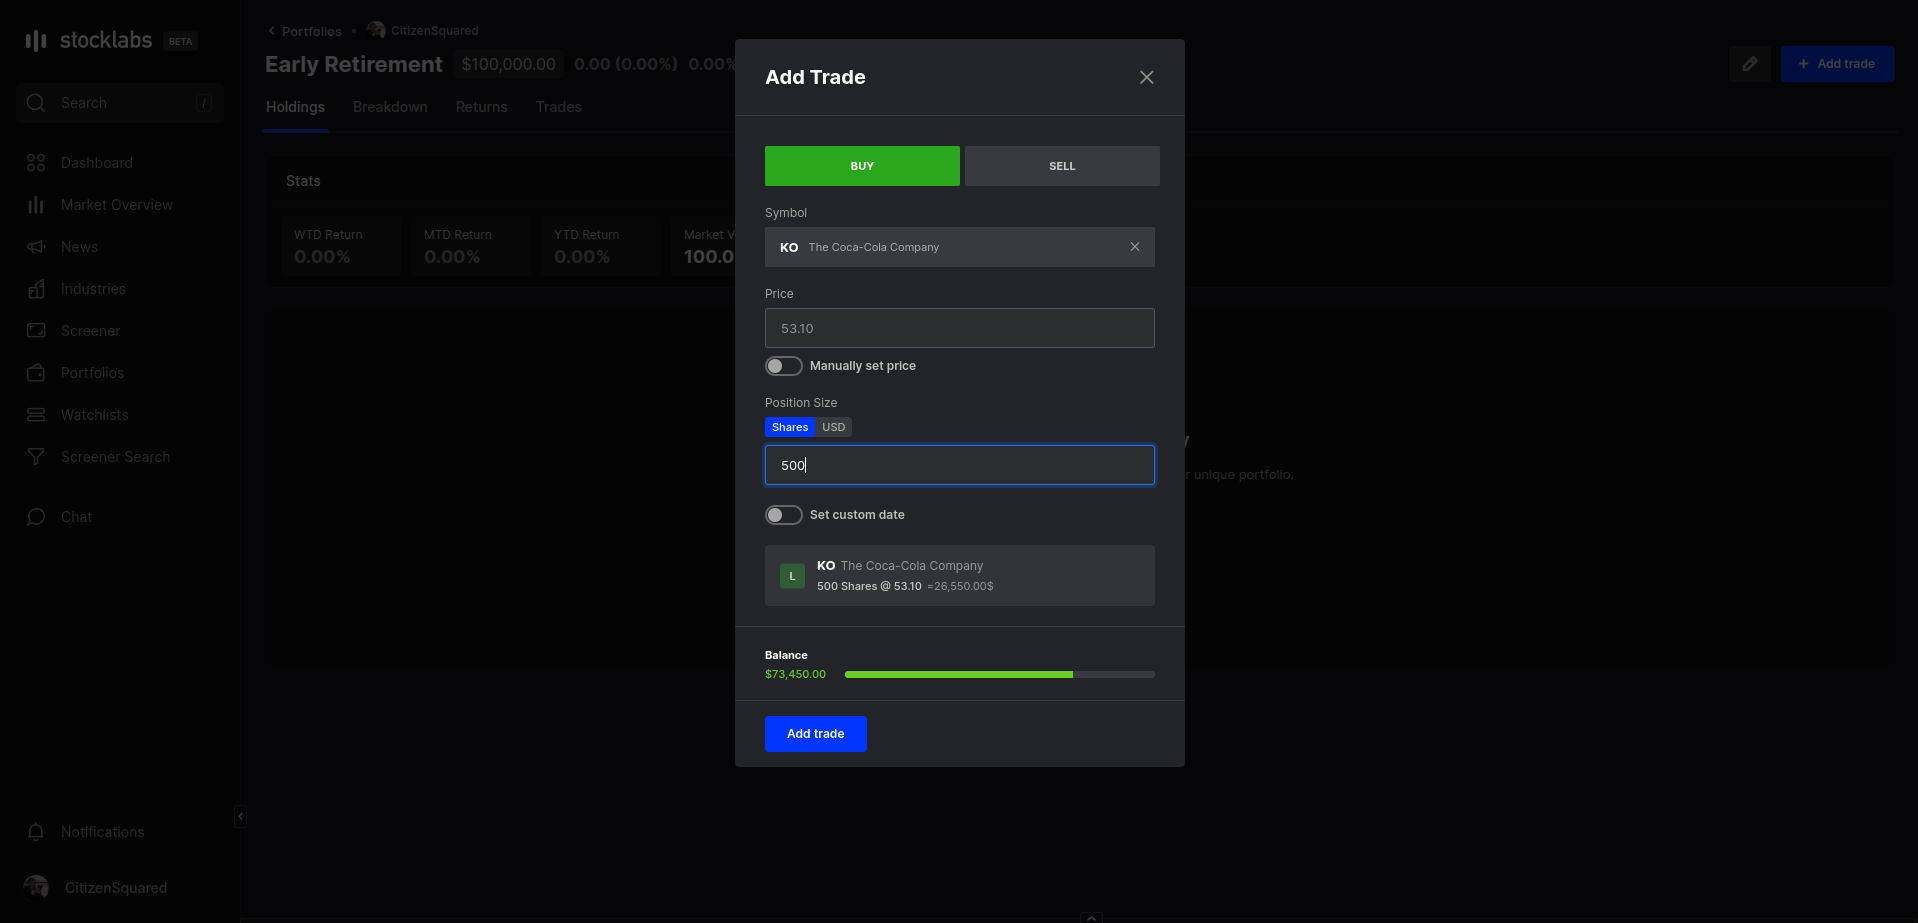
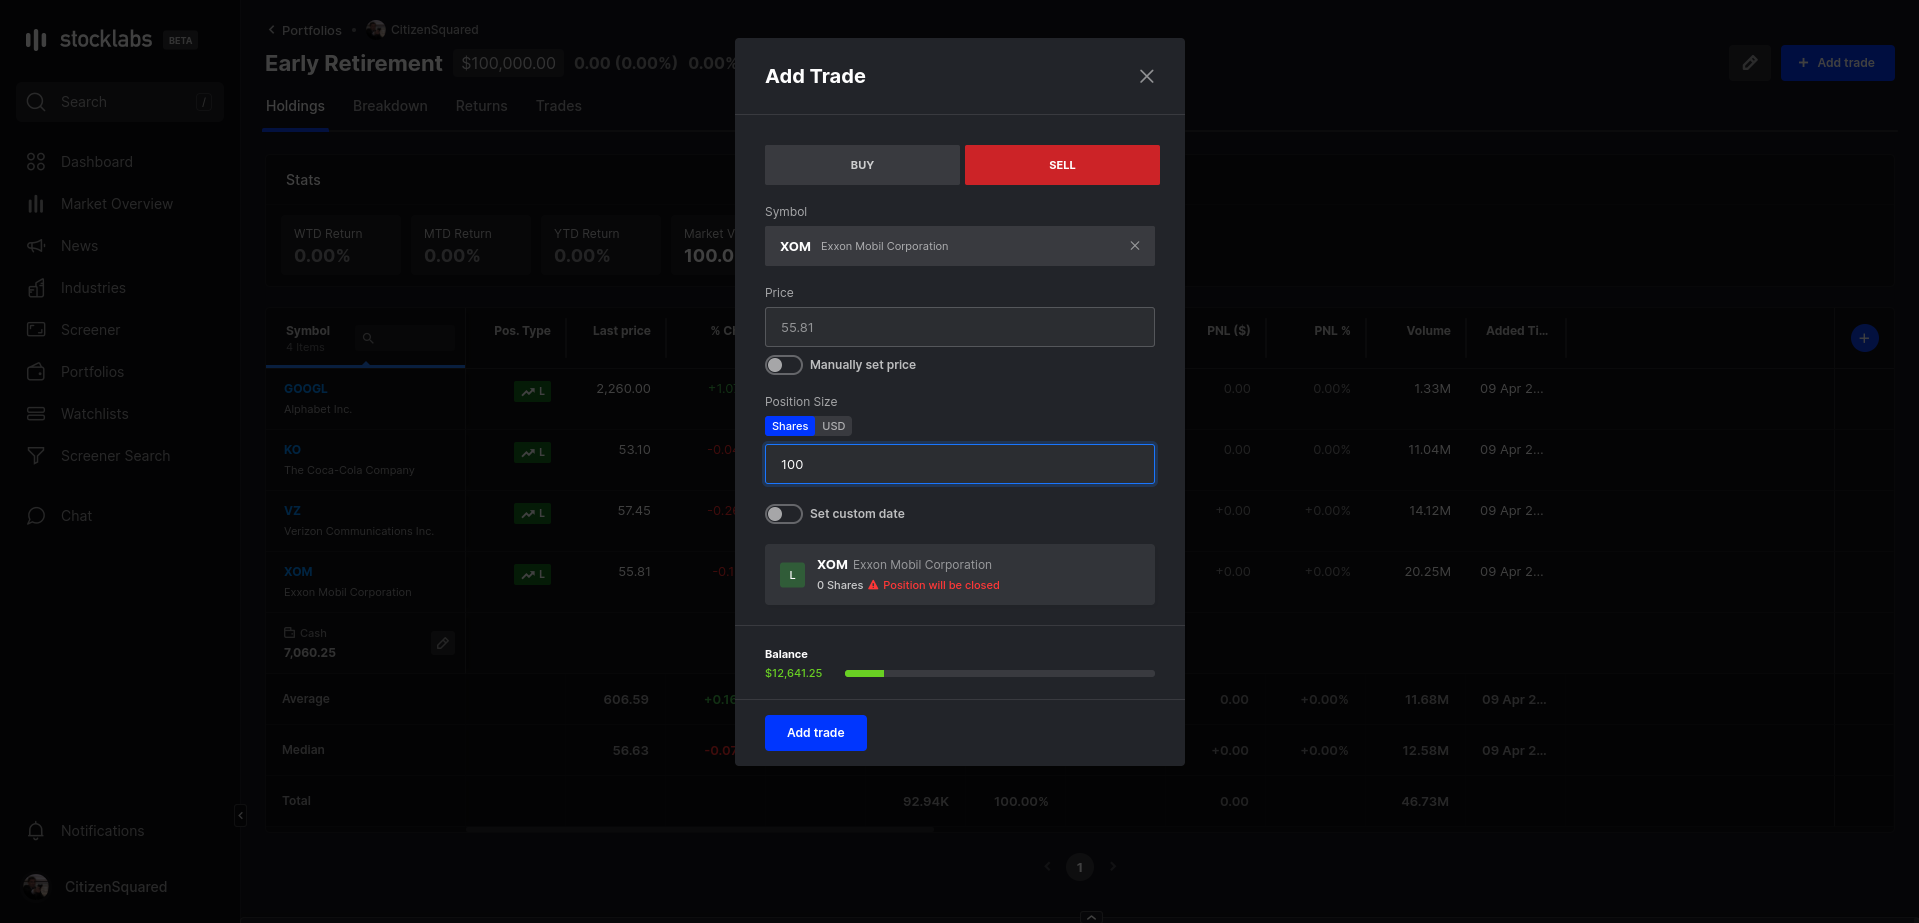
The Add Trade dialogue opens up the ticket to be filled out with details of the trade. Buy or Sell at the top, followed by the ticker below. Stocks can be found by typing the company name or the ticker. The price window auto-populates with the prevailing price in the market; alternatively, the option to manually enter your trade price is available with the toggle just below, which un-greys the Price box for entry. Position size can be specified either by number of shares bought or dollar amount of the transaction. Lastly, Stocklabs assumes the trade is being entered real time or that day, but if not, the "Set custom date" toggle opens up a calendar to select the actual date of the transaction if it took place another time. Repeat this process until your holdings are all displayed and voila, you've successfully accounted for your positions & are now ready to begin tracking.
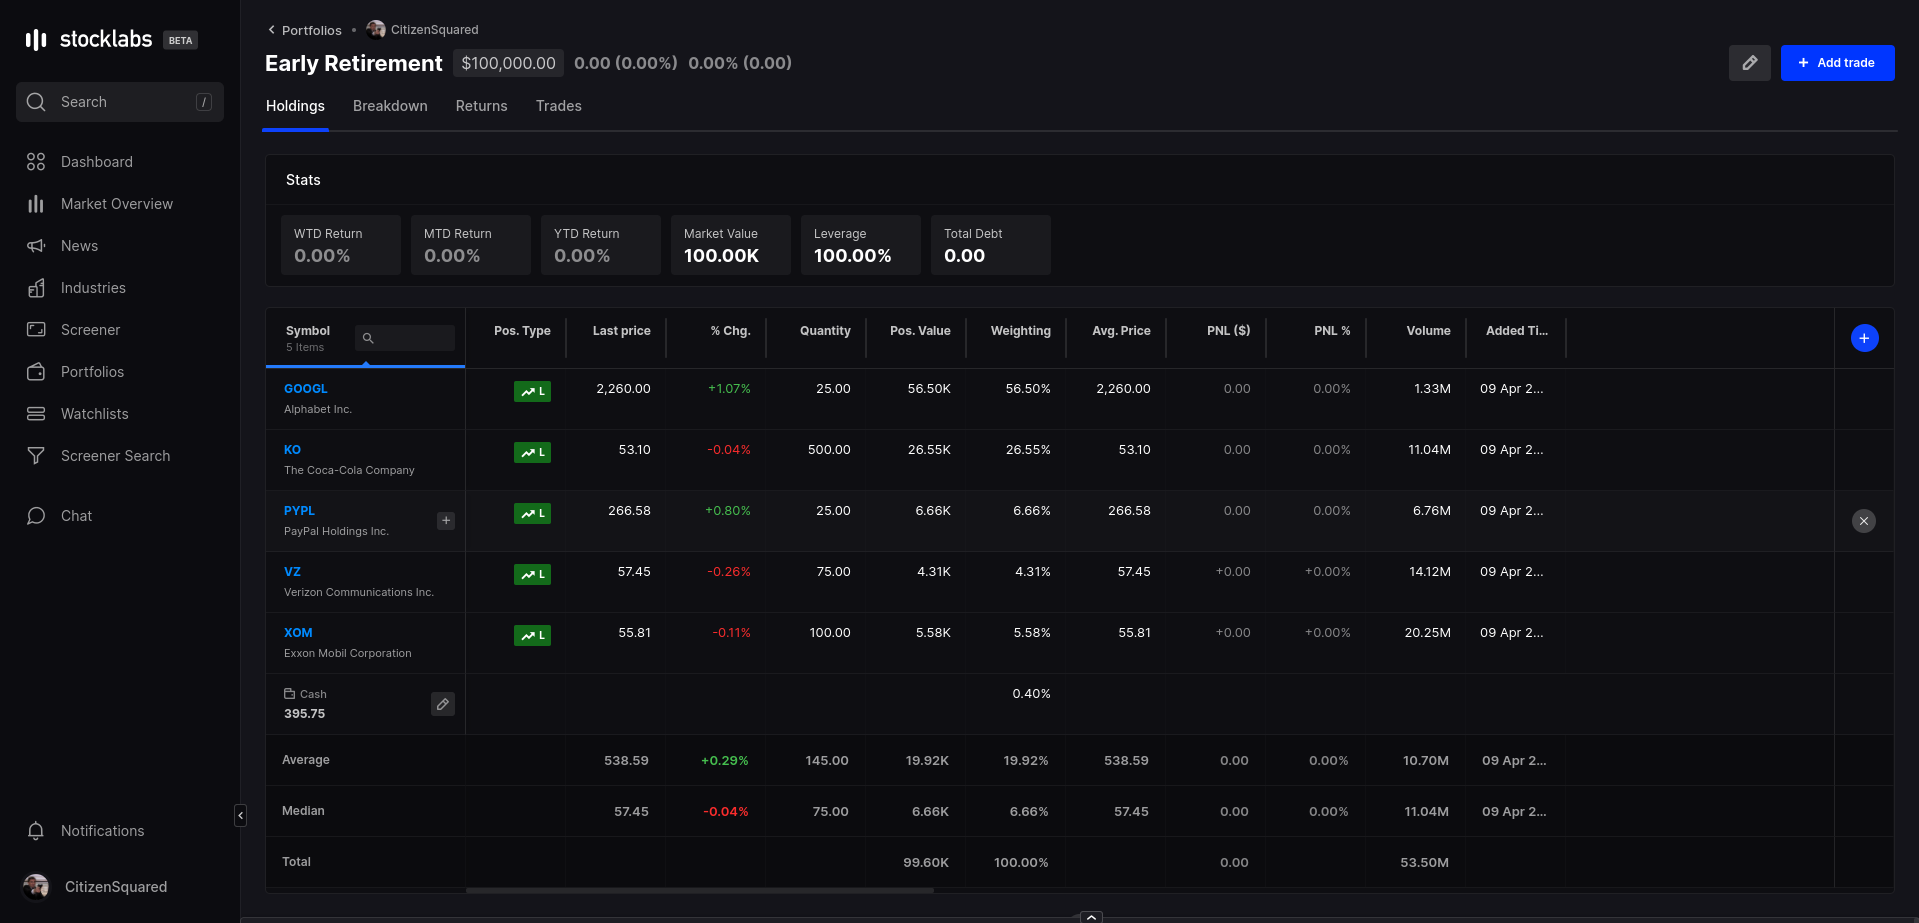
Closing out a position can be done 1 of 2 ways. The simplest way, if being logged in real time, is to hover over the row of the holding, finding the "X" to the far right & clicking it, which performs the sale directly at the current price without any additional steps. The other method to close a position is to go back to the Add Trade dialogue & filling out the form in the same way as when the position was entered except changing the ticket to Sell at the top.
Tracking A Portfolio
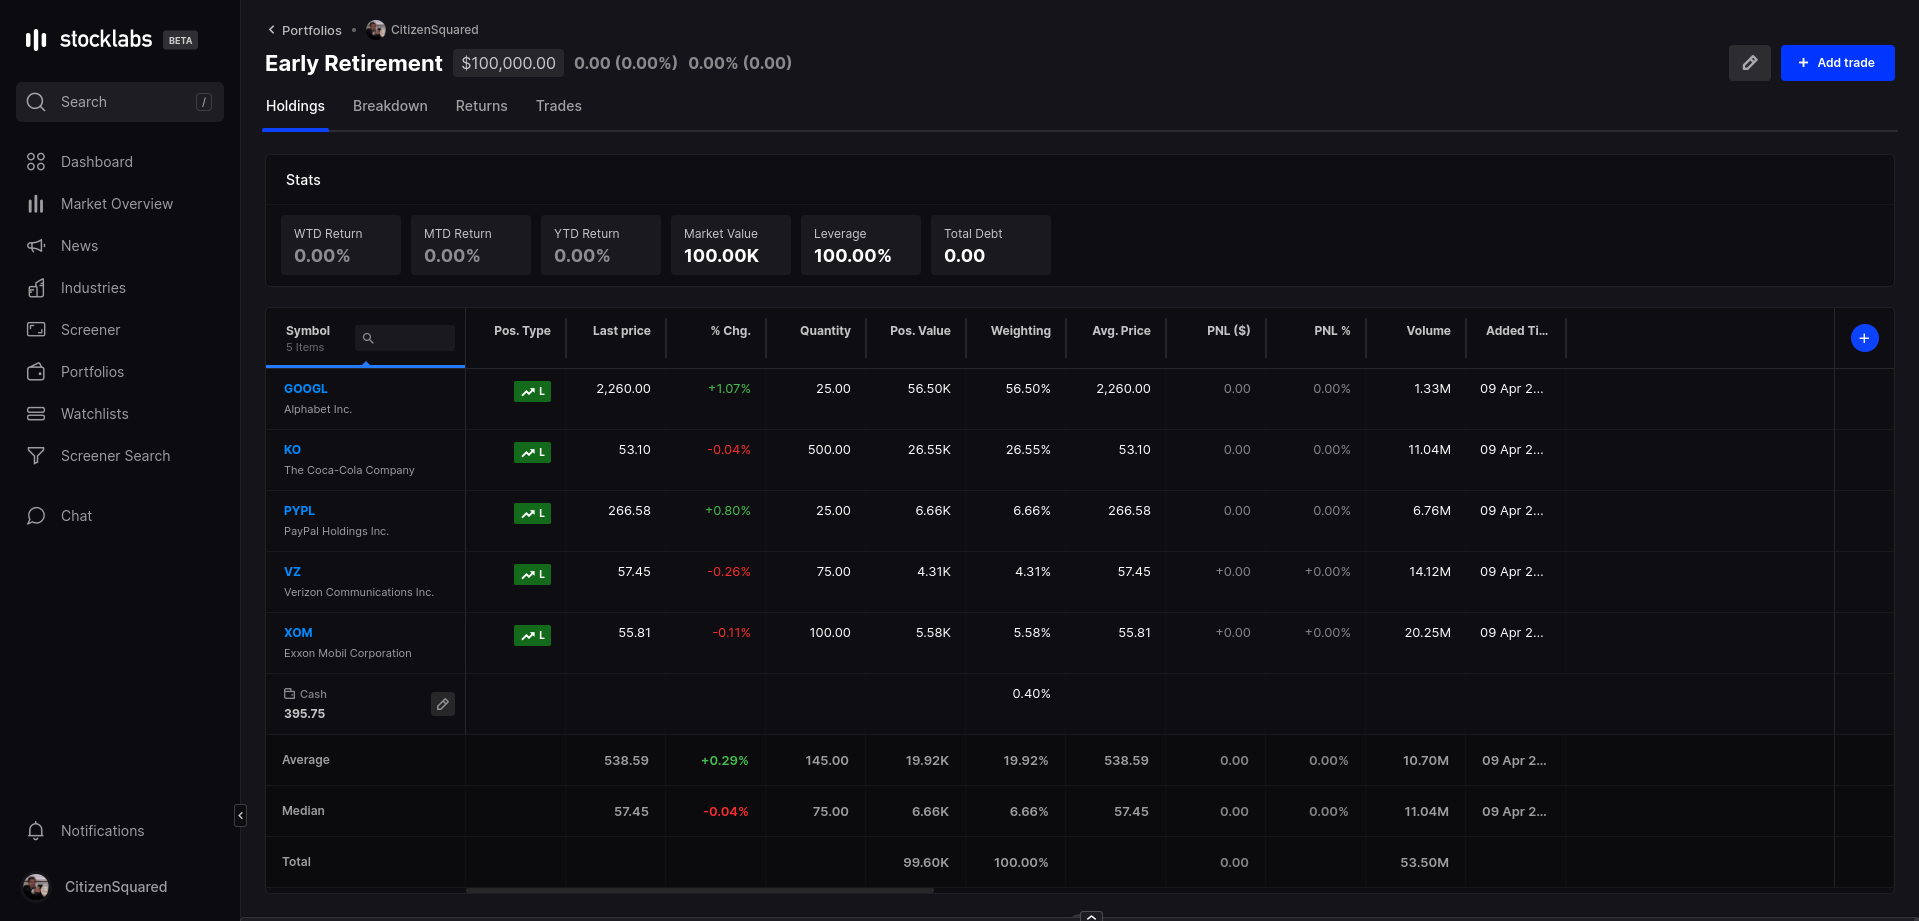
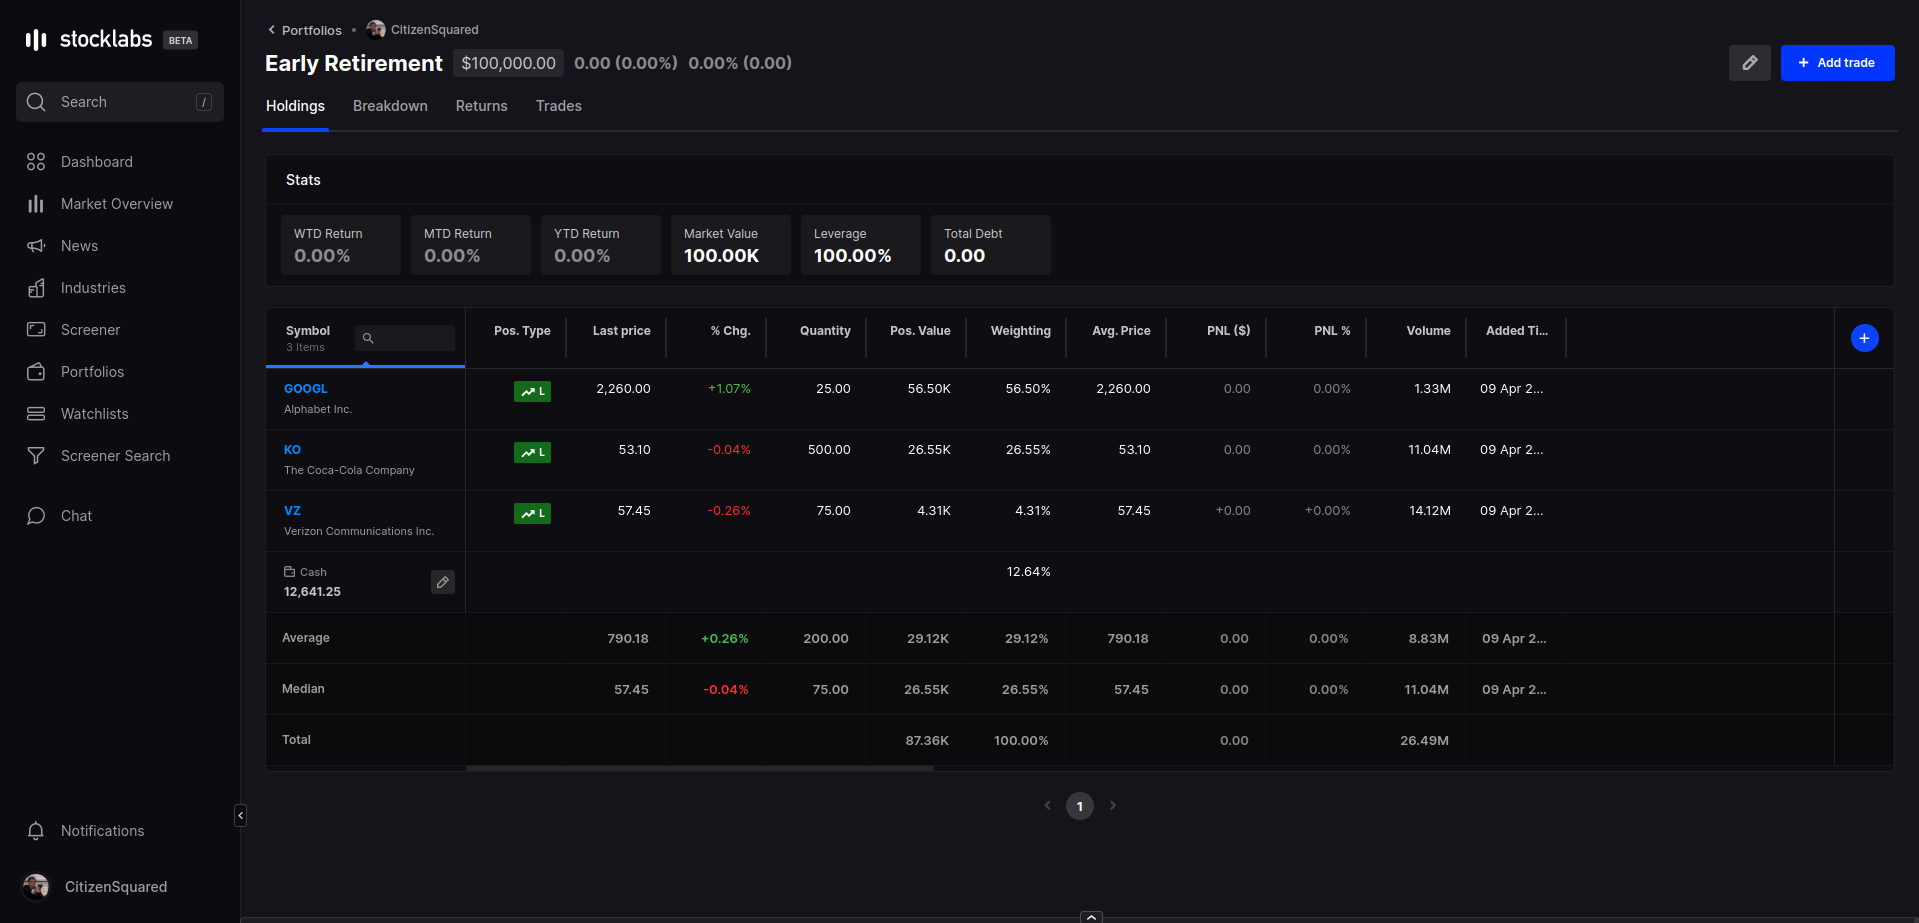
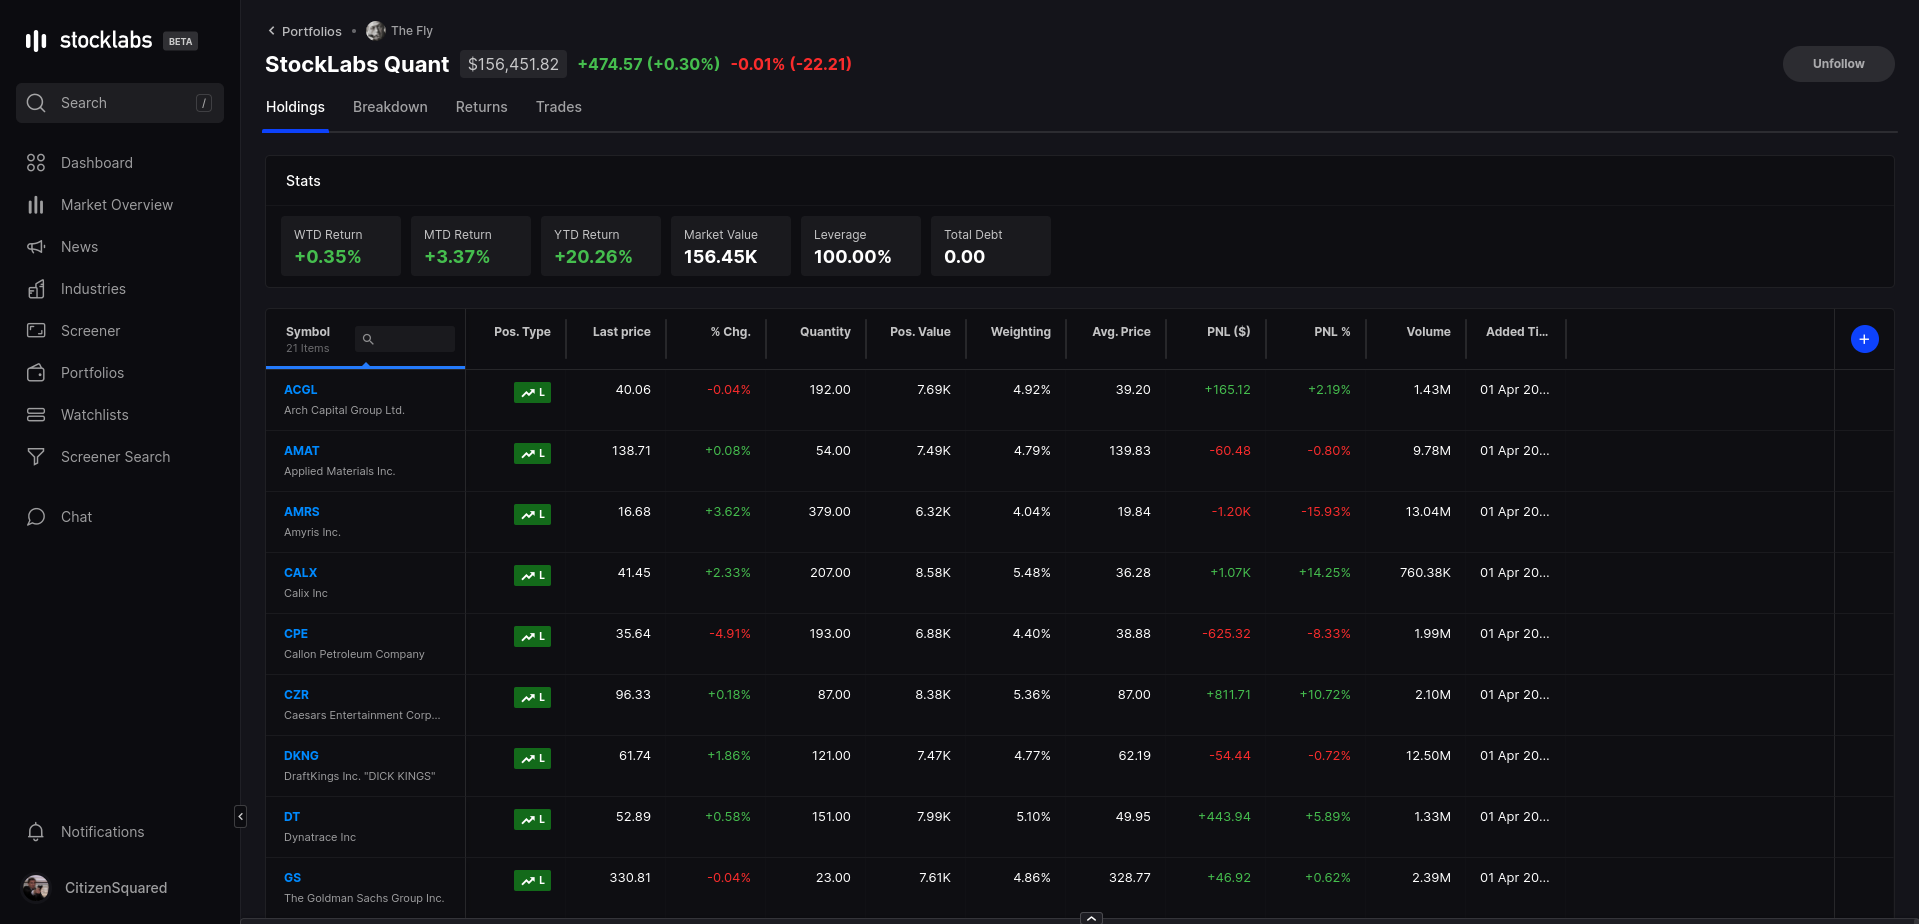
Over time as buys & sells are entered & positions increase or decrease in value, Stocklabs will automatically log statistics along the way to be reviewed at your discretion. Viewing any portfolio, the tabs across the top can be used to look at all the information of the portfolio. The Holdings tab displays the current positions held in the portfolio. The statistics across the top show the accrued returns of trades entered on a WTD, MTD, & YTD basis, as well as the portfolio value. Columns divide each holding's relevant statistics to the portfolio, with the bottom of each column displaying its average, median, & total values. The Cash Balance of the portfolio can be found just under the last listed holding.

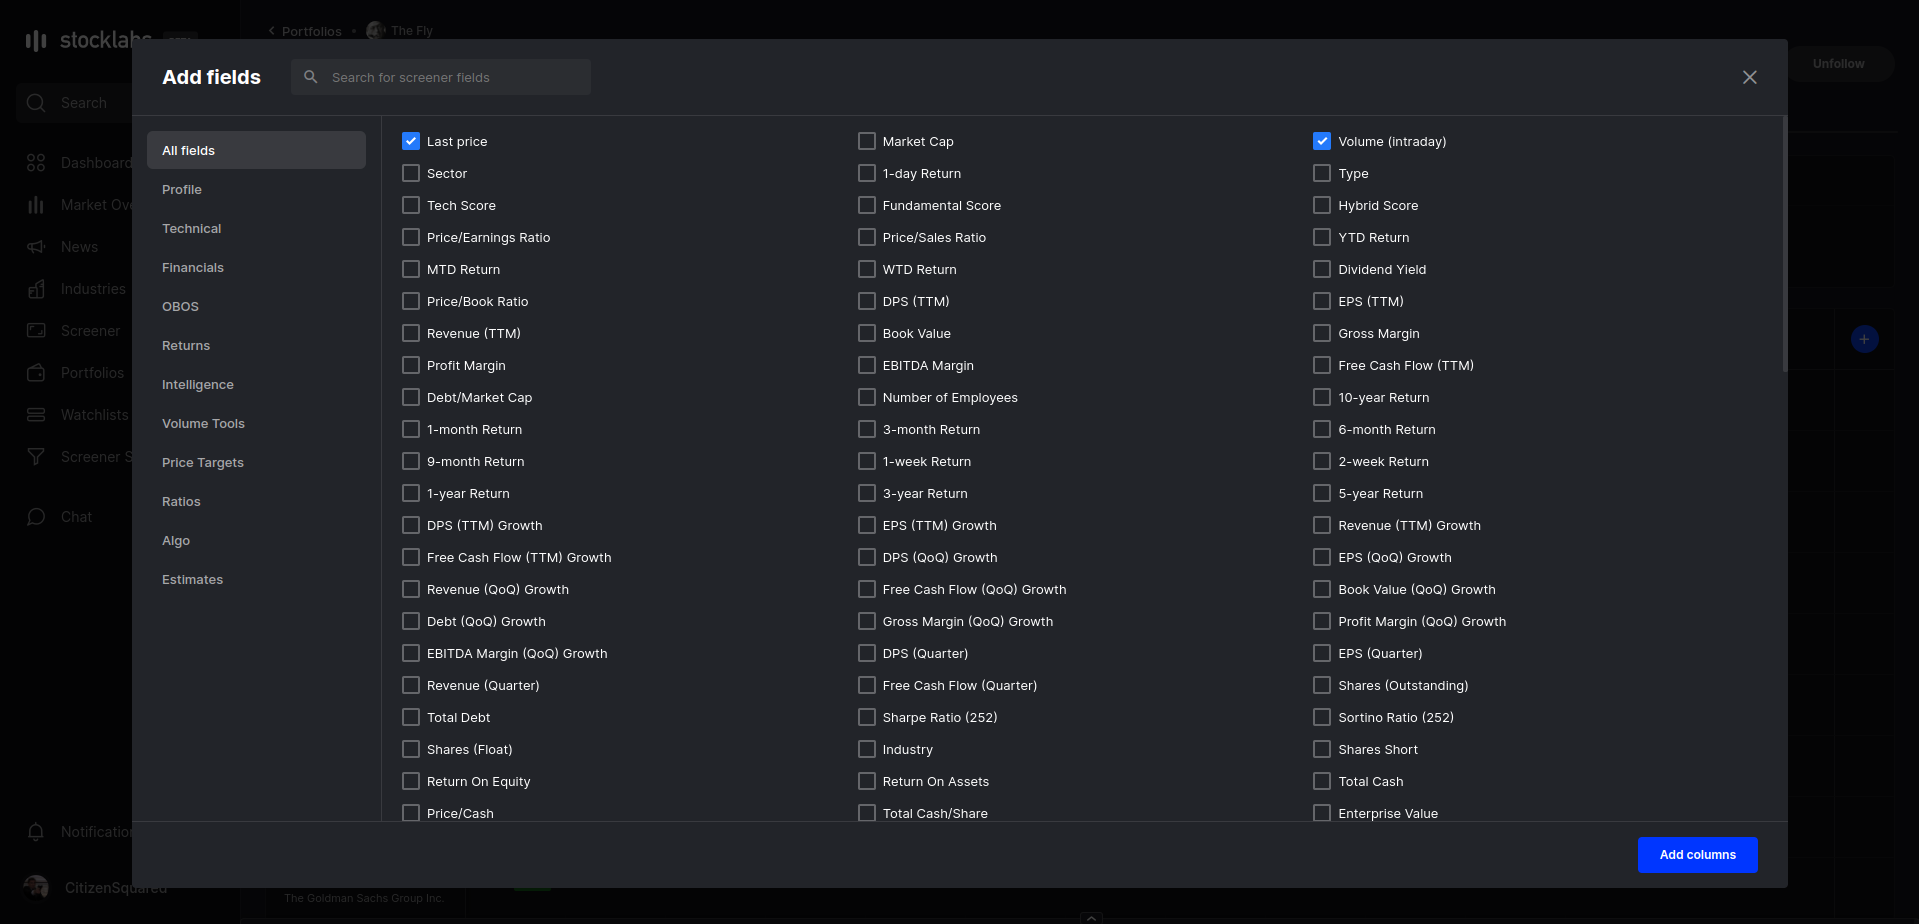
The "+" sign in the top right of the pane opens the Screener window with the option to add any criteria inside Screener to the portfolio.
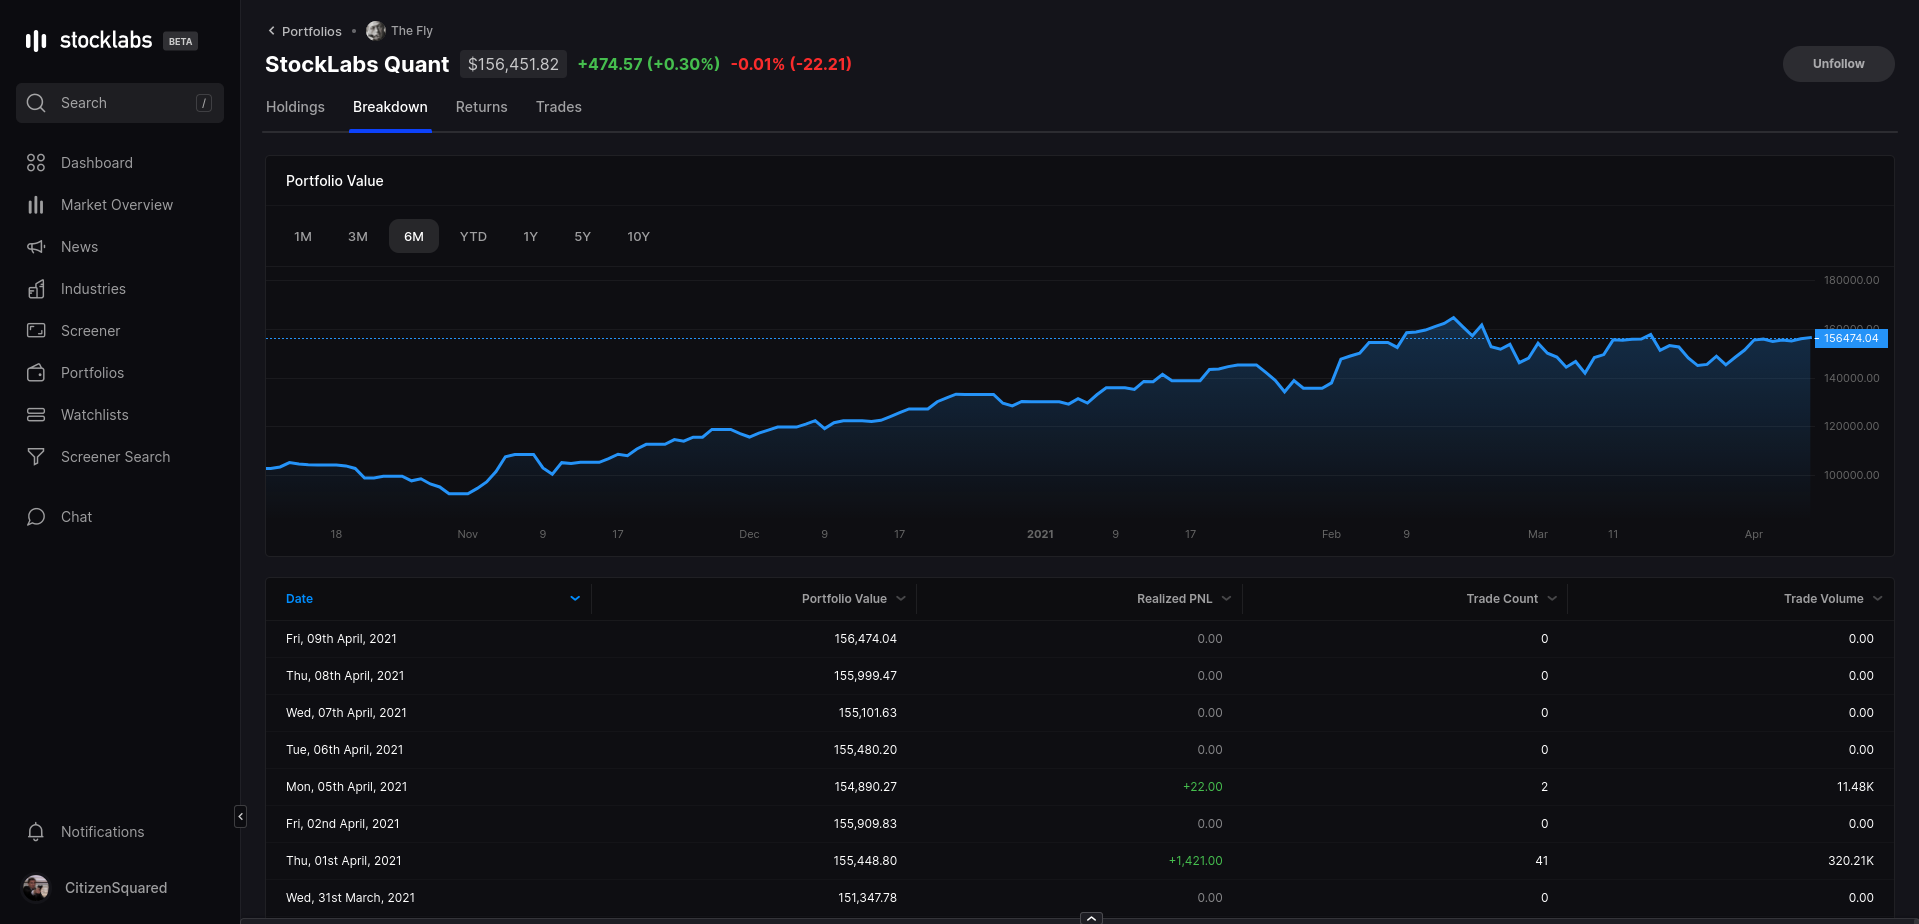
Moving to the Breakdown tab, across the top is a line chart of portfolio value over timeframes ranging from 1 month to 10 years, while the table below breaks down the Realized PNL, Trade Count, & Trade Volume by day.
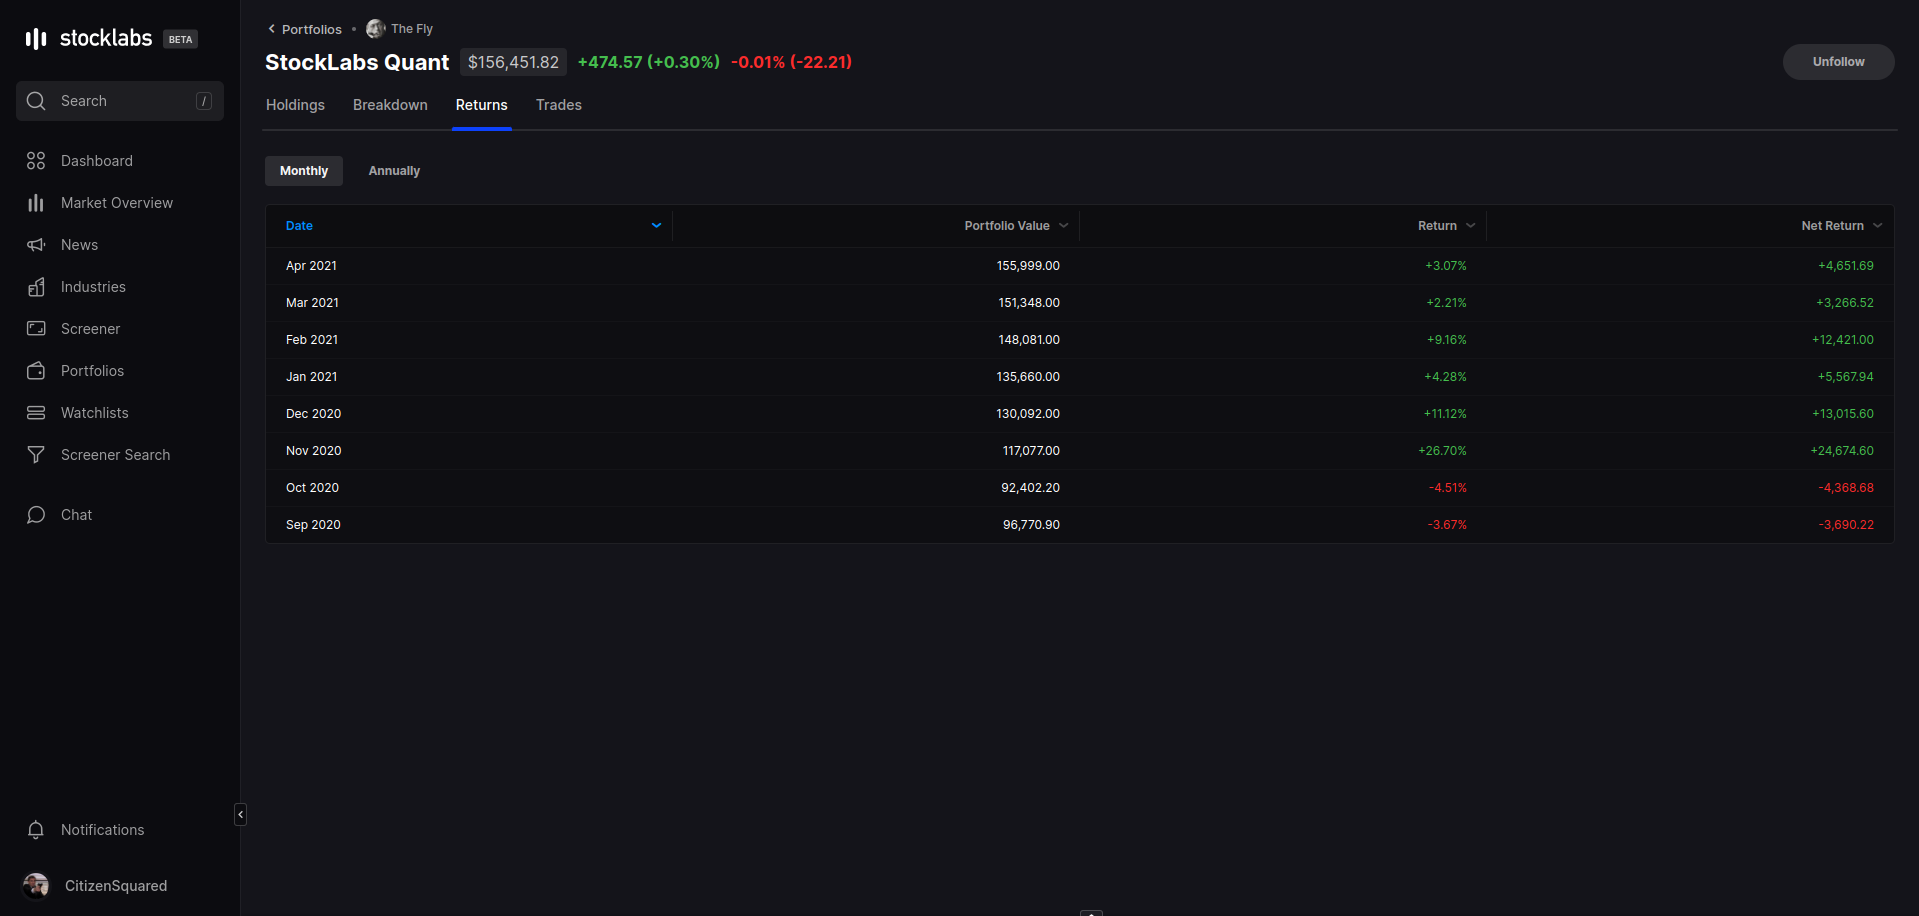
The Returns tab presents a table of Portfolio Value as well as returns by percentage & Dollar value. The data can be viewed on a Monthly (default) basis or Annually.
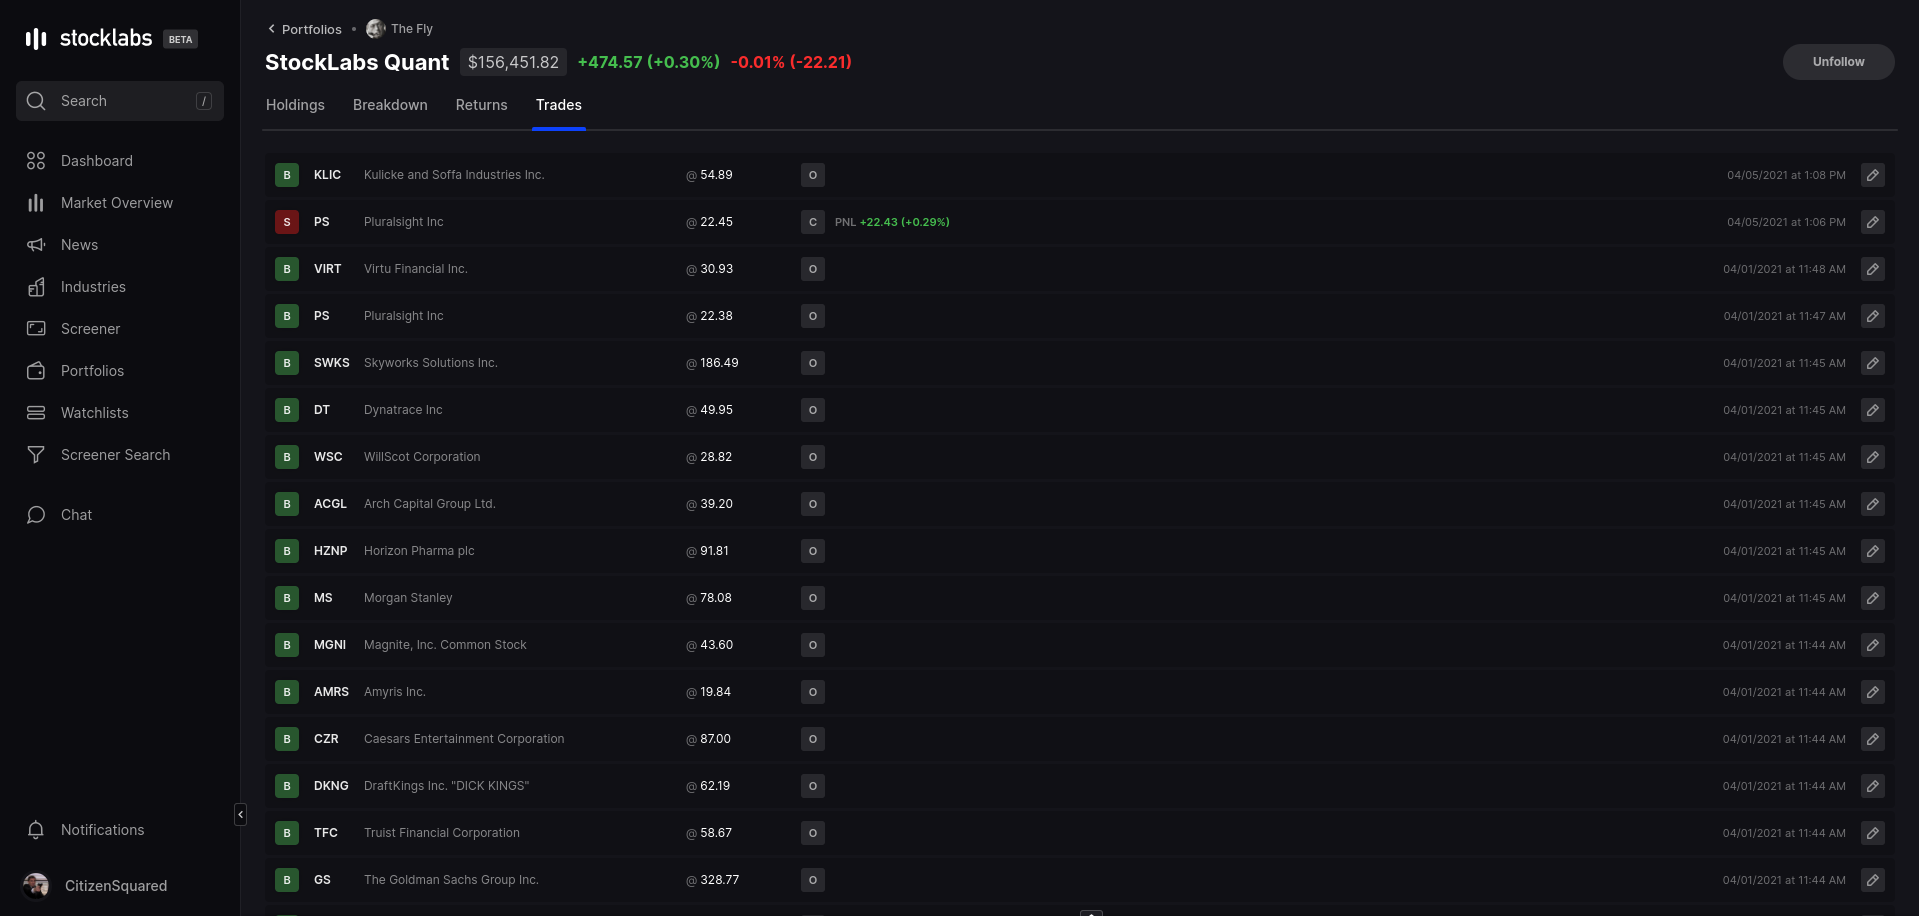
In the Trades tab, a list of all the trades entered into the portfolio are shown. Buys & Sells with the price as well as date on the far side. The column of "O" or "C" denotes the status of the position as Open or Closed. Positions marked "C" will also print the Realized PNL for the trade directly into the column.
Off You Go!
This primer gives you everything you need to know to begin using the Portfolios features inside Stocklabs. Tracking your performance is a key step in finding what works or doesn't work in order to make improvements to your trading & investing performance over time. See you inside Stocklabs.
Comments
0 comments
Please sign in to leave a comment.