
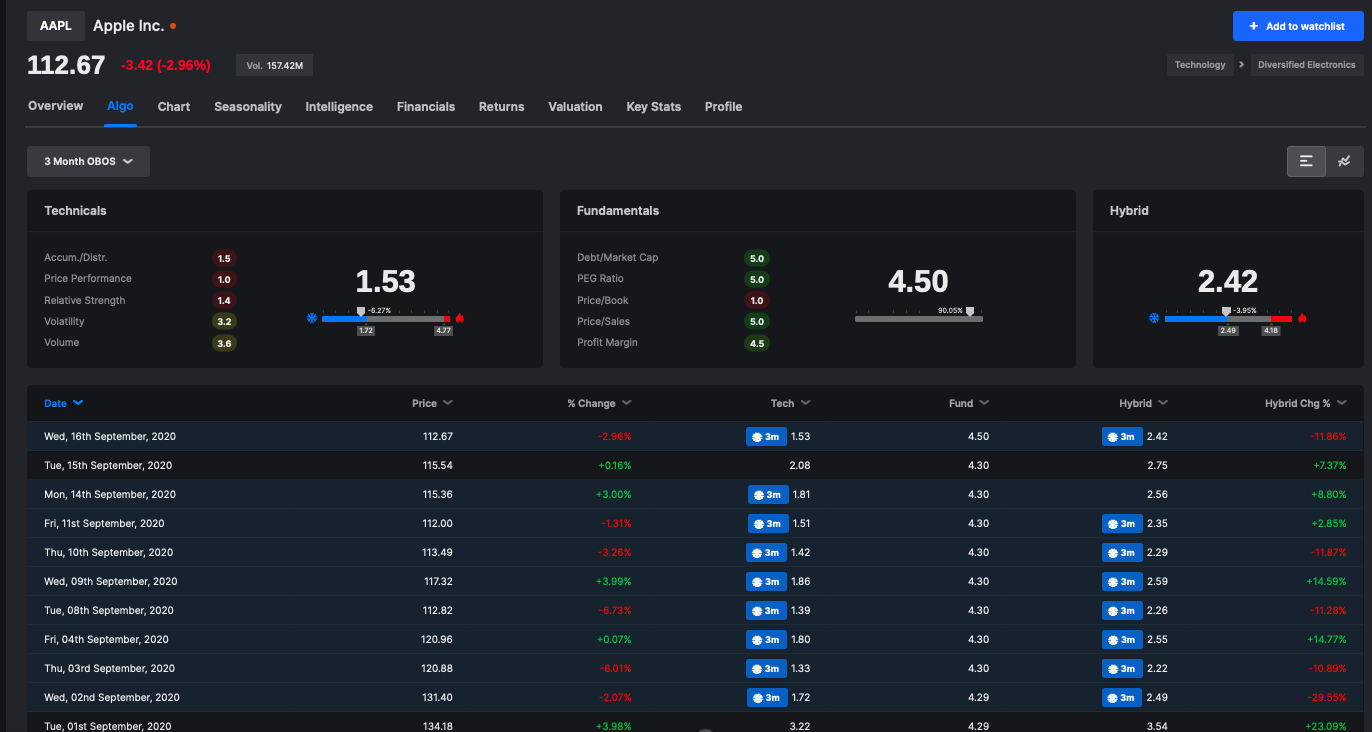
Stocklabs ranks stocks by both technicals and fundamentals, producing what we call a "Hybrid" score, which is a blend of both metrics. The foundation of the technical score is rooted in 5 principle metrics.
TECHNICALS
Accumulation/Distribution
A technical score between 1 (lowest) and 5 (highest) that measures the difference between a security’s last quoted price and its intraday high and low. In general, securities trading near their intraday high have Accumulation/Distribution scores near 5
Price Performance
A technical score between 1 (lowest) and 5 (highest) that measures the proximity of the last quoted price relative to where the security closed 90 trading sessions ago. In general, if a security’s price has gone up over the past 90 sessions, its Price Performance score will be near 5.
A technical score between 1 (lowest) and 5 (highest) that measures the proximity of the last quoted price to the security’s 52-Week High. In general, securities near their 52-week highs have relative strength scores near 5.
A technical score between 1 (lowest) and 5 (highest) based on the security’s beta. In general, the higher the absolute value of the security’s beta, the higher its Volatility score will be.
A technical score between 1 (lowest) and 5 (highest) that expresses the amount of trading activity in the most recent ‘complete’ session (relative to the average volume of the security over the past few weeks). In general, if a security’s most recent volume is higher than usual, its Volume Score will be near 5.
Additionally, we have a hidden metric running on the Stocklabs servers, privately dubbed 'Sub Rosa' , which assesses price action in all major commodities, treasuries, and currencies and either adds to or subtracts from technical score on an intra-day basis. For example, if oil is +5% for the session, there is a strong probability the sub-rosa calculations will offer a significant bump to the technical scores of oil stocks. Conversely, we also penalize the sectors that need commodities as part of their input cost. In this instance, a 5% bump in crude will effectively REDUCE the technical rating of airlines and certain plastics companies.
FUNDAMENTALS
A fundamental score between 1 (lowest) and 5 (highest) that reflects a company’s debt burden. In general, the lower a stock’s debt/equity ratio is, the higher its Debt/Equity Score will be.
A fundamental score between 1 (lowest) and 5 (highest) that conveys how ‘expensive’ a stock is, relative to its earnings growth rate. In general, the lower a stock’s PEG ratio is, the higher its PEG Ratio Score will be.
A fundamental score between 1 (lowest) and 5 (highest) that conveys how ‘expensive’ a stock is relative to its book value. In general, the lower a stock’s price/book ratio is, the higher its Price/Book Score will be.
A fundamental score between 1 (lowest) and 5 (highest) that conveys how ‘expensive’ a stock is relative to its sales. In general, the lower a stock’s price/book ratio is, the higher its Price/Sales Score will be.
A fundamental score between 1 (lowest) and 5 (highest) that reflects the profitability of the company’s underlying business. In general, the higher a company’s profit margins are, the higher its Profit Margin Score will be.
In addition to the above metrics, we also have what's called a "Sixth Column", which is a measurement of ROE (Return on Equity) that can either reduce or add to the fundamental score.
HYBRID SCORE
We've tooled around with innumerable combinations to concoct the best Hybrid score, which best represents a stock based on its technicals and fundamentals and settled on 70% technical, 30% fundamental.
Comments
0 comments
Please sign in to leave a comment.